
Figure 11. Funnel plot of all combination studies ([27] eliminated).
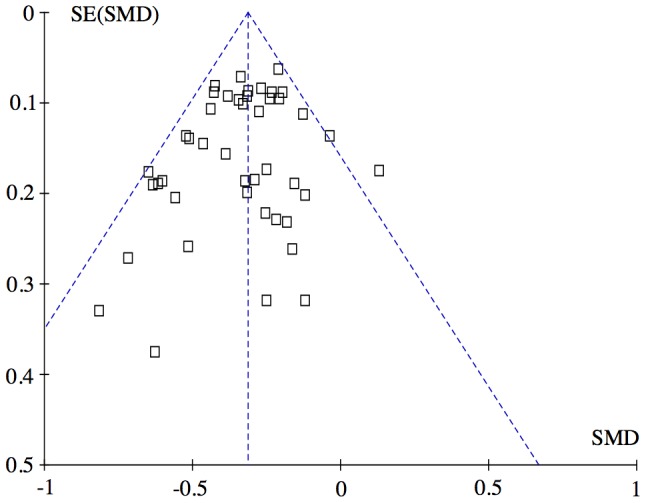
The left lower corner is empty compared with the right lower corner. This asymmetry may indicate that small studies with no effect was not published (publication bias). However, this asymmetry is quantitatively small, and probably does not affect the overall result. Exclusion of the three lower right studies [18], [19], [44] to eliminate the asymmetry did not change the overall result shown in Figure 2: −0.31 SMD (CI: −0.35, −0.27), test for overall effect: Z = 16.49 (P<0.00001). Heterogeneity: Chi2 = 48.41, df = 40 (P = 0.17); I2 = 17%. Abbreviations: SMD: Standardized mean difference.