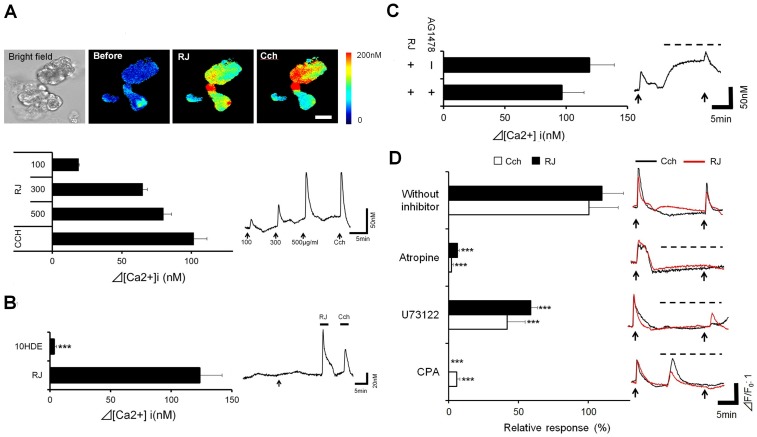
Figure 4. Effect of royal jelly on lacrimal gland acinar [Ca2+]i mobilization.
A: Changes in [Ca2+]i in normal lacrimal acinar cells. Pseudo colored images of [Ca2+]i (Upper). Scale bar, 50 µm. The bar graph shows the summarized data of the amplitudes of [Ca2+]i responses. (n = 13 acini) B: Effect of 10-HDE (Left, n = 14 acini). The typical response to 10HDE (Right). C: Effect of AG1478 (n = 10 acini). D: Effect of muscarinic acetylcholine pathway inhibitors (Left, n = 22–53 acini). Responses to the stimulation with or without inhibitors (Right). The arrow indicates the time at which RJ or CCH was applied to the cells. Dotted line over the trace indicated the presence of each inhibitor. Relative responses were calculated as a percentage of the decrease in the RJ-induced [Ca2+]i response with the application of an inhibitor relative to the stimulation seen with RJ alone in each acinus. All data represent the mean ± SE. ***P<0.001 versus RJ (Fig 4C) or without an inhibitor (Fig 4D).

