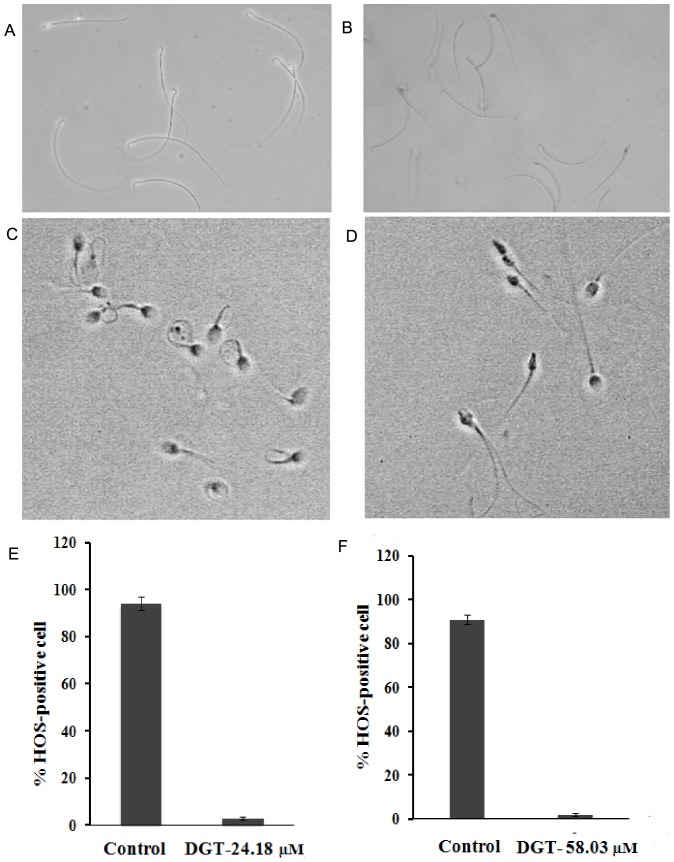
Figure 3. The HOS responsiveness of the sperm, as indicated by tail coiling.
HOS responsiveness of rat sperm as tail coiling: (A) Untreated control. (B) DGT-treated rat sperm (24.18 µM) examined under a phase contrast microscope (40×). Response of control (C) and DGT-treated (D) human sperm (58.03 µM) population following exposure to hypo-osmotic solution and evaluation under a phase contrast microscope. Over 90% of control-untreated sperm exhibited HOS response typically characterized by tail coiling, where as sperm exposed to DGT at MEC examined no response under a phase contrast microscope (40×). (E): For rat sperm, (F): For human sperm. Each bar represents the mean ± SEM of five observations (P<0.05).

