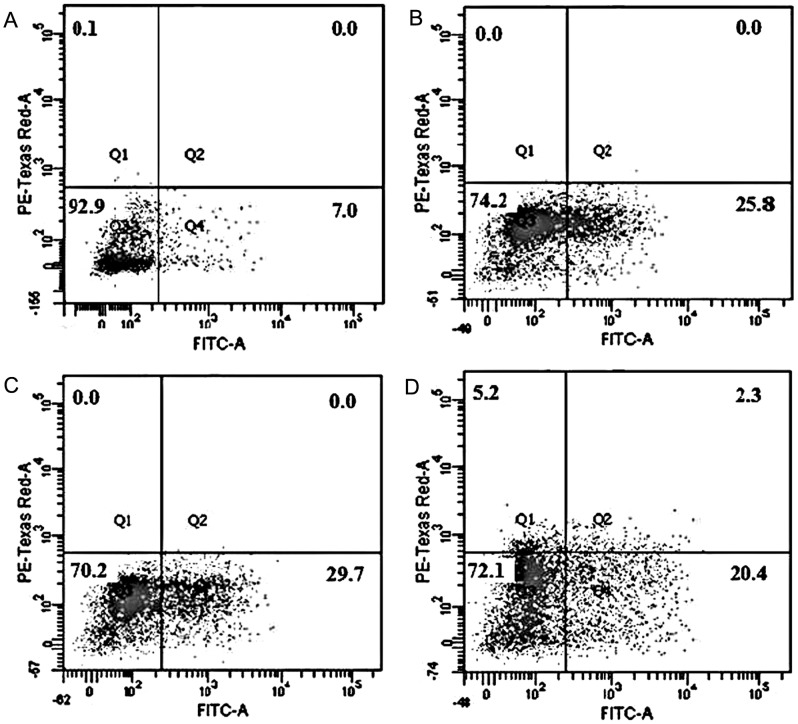
Figure 9. Apoptotic changes in plasma membrane.
Representative images of apoptosis/necrosis induction by DGT in sperm cells, measured by Annexin-V/PI labelling and flow cytometry. Concentrations used were 29.01 µM, 58.03 µM and 106.38 µM of DGT against sperm for 3 h. [A. control, medium only, B. 29.01 µM DGT, C. 58.03 µM DGT, D. 106.38 µM DGT]. Cell population in four quadrants identified as: [lower left, live; lower right, apoptotic; upper right, necrotic; upper left, dead].

