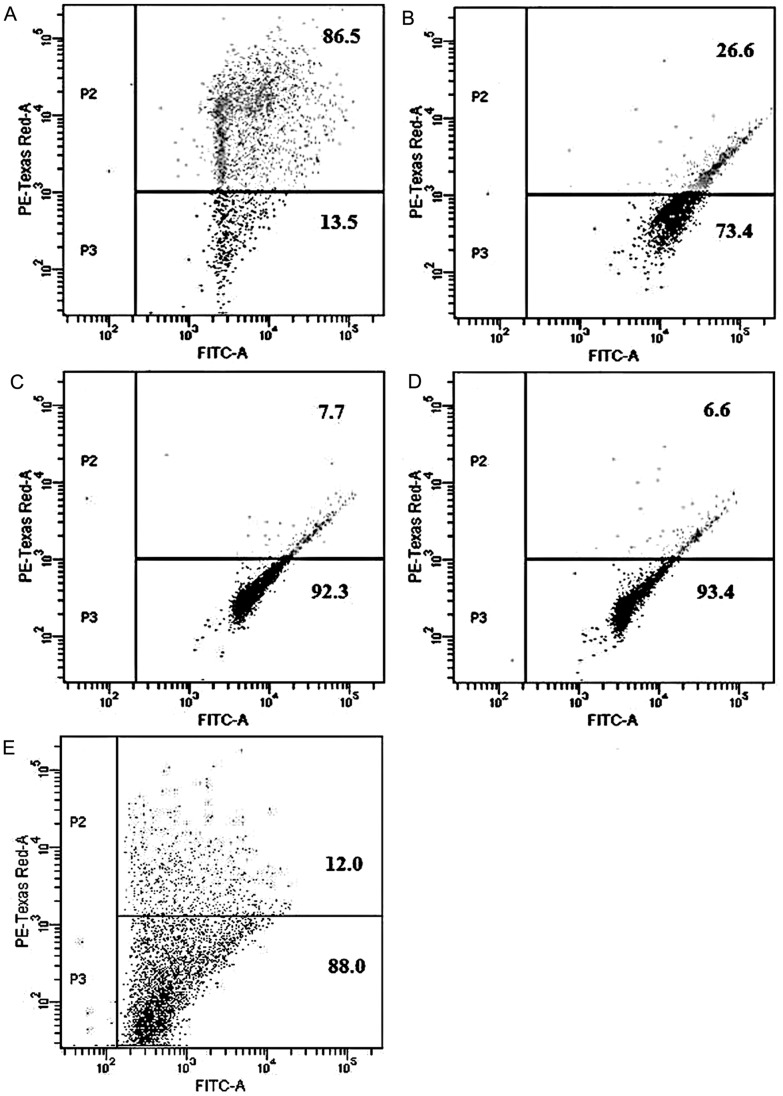
Figure 10. Apoptotic changes in mitochondria.
Representative illustration of the depolarization of mitochondrial transmembrane potential of sperm cells by DGT, measured by lipophilic cationic dye JC-1 staining. Concentrations used were 29.01 µM, 58.03 µM, and 106.38 µM against sperm for 3 h. [A. control, medium only, B. 29.01 µM DGT, C. 58.03 µM DGT, D. 106.38 µM DGT, E. CCCP]. Cell population in quadrants identified as: [upper right, polarized; lower right, depolarized].

