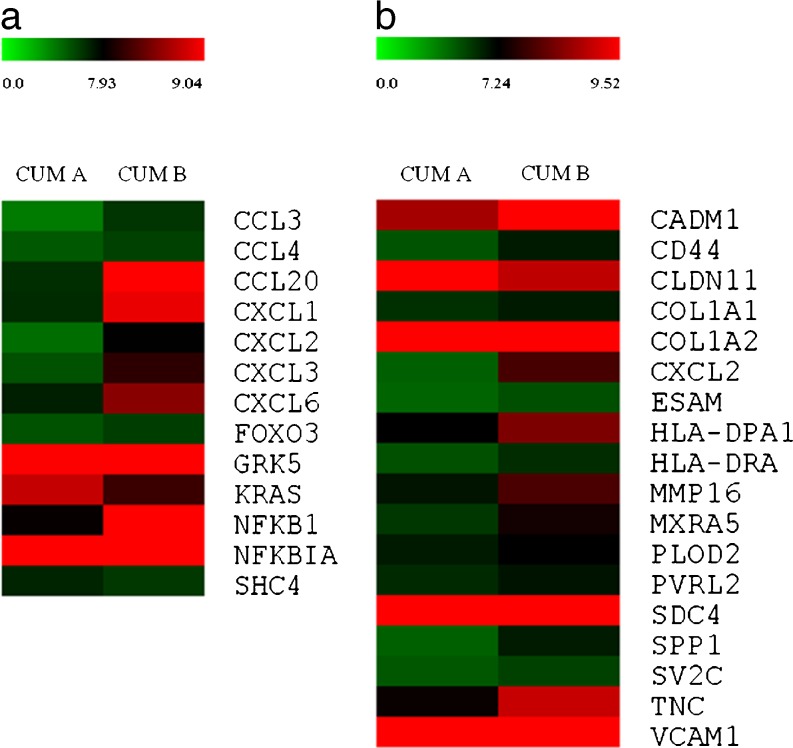
Fig. 2.
Heat maps of DEGs involved in main pathways, deregulated in the CC of patients with endometriosis. The clustering of DEGs involved in (a) chemokine signaling pathway and (b) cell-cell and cell-ECM adhesion mechanisms, identified by integrated analyses using KEGG and BioCarta databases. For an over-represented KEGG or BioCarta pathway, a cut-off p value of 0.01 was selected. The heat maps were generated from microarray data, reflecting gene expression values (p < 0.05 and fold change ≥1.5) in the cumulus oophorus cells of patients with severe endometriosis (Group a) in comparison to control cells (Group b). Each row represents the expression levels for a single gene tested for the two experimental conditions. Each column shows the expression levels for the genes, which were tested for each group of individuals. The absolute expression value (log scale) of each gene has been derived from the mean of two replicates. The color scale bar on the top represents signal intensity variations, ranging from green (poorly expressed genes) to red (highly expressed genes). The black boxes indicate intermediate expression values.

