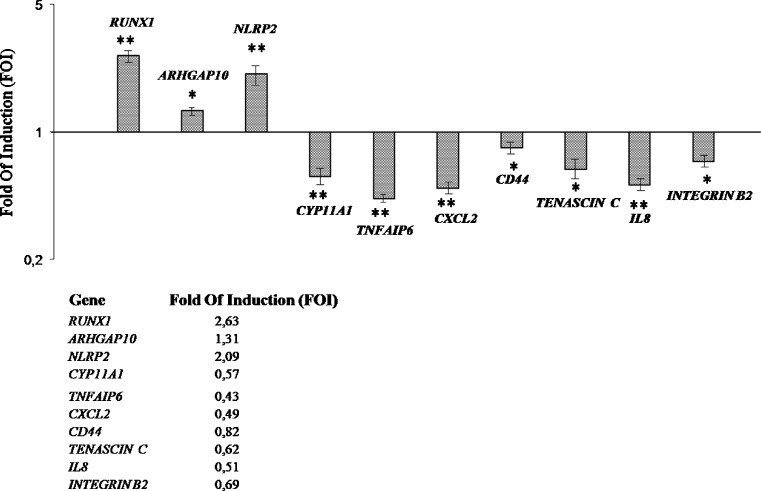
Fig. 3.
An RT-PCR analysis of expression levels of selected differentially expressed genes in oophorus cumulus cells from endometriosis patients vs control. It is shown the relative expression of the mRNA of differentially expressed genes in oophorus cumulus cells from endometriosis patients (n = 5), normalized for GAPDH and plotted as a fold of increase over cumulus cells of control patients (n = 7). Results represent the mean ± SD (*P < 0.001; **P < 0.05)

