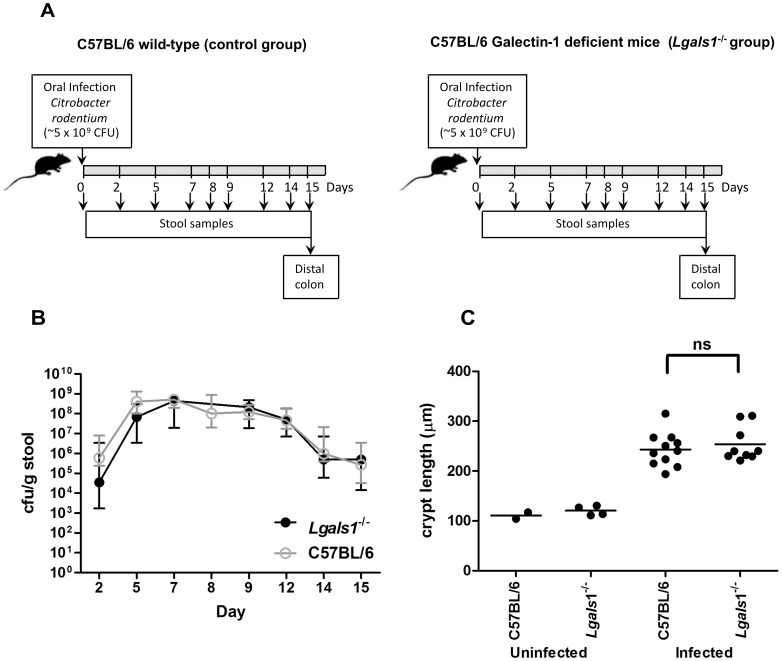
Figure 3. Galectin-1 deficient mice showed infection kinetics similar to wild-type controls and normal hyperplasia levels.
A. Scheme of the protocol used for infection and sampling; B. Data represent colony forming units (cfu) of C. rodentium shed per gram of stool by infected C57BL/6 wild-type controls (open circles) and infected Galectin-1 knockout (Lgals1 −/−) mice (closed circles) at different stages of the infection plan. Dots indicate the median and interquartile range of groups of 10 animals; C. Crypt length at day 15 post infection is plotted. Dots indicate the average crypt length per mouse, while horizontal lines indicate the average per group of mice (n = 2–4 for uninfected mice and 9–11 for infected mice). Data was obtained from 2 independent infection experiments, “ns” means no significant difference (p>0.05) between infected galectin deficient and wild-type mice.

