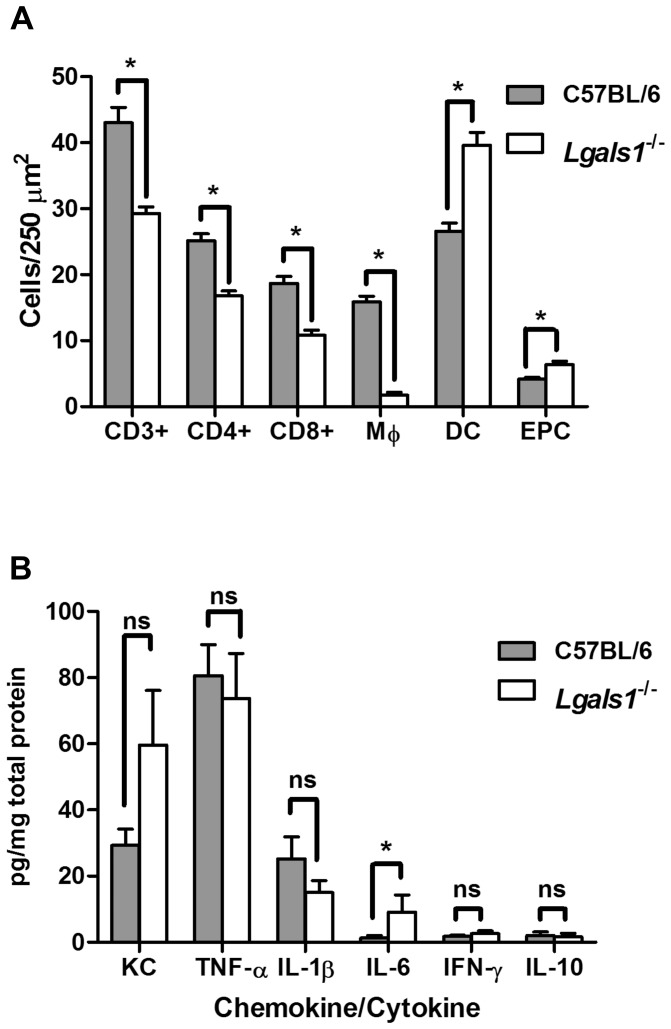
Figure 4. Galectin-1 deficient mice showed increased neutrophil and DC infiltrates and enhanced expression of IL-6 and KC.
A. Number of CD3+ cells, CD4+ cells, CD8+ cells, macrophages (MΦ), endogenous peroxidase-containing (EPC) cells (most commonly neutrophils) and DC (dendritic cells) per 250 µm2 of colonic lamina propria in C. rodentium infected mice. Bars indicate the average for each group of 10 C57BL/6 wild-type and Lgals1−/− animals; B. Data show cytokines and chemokine levels as pg per mg of total proteins in the colonic tissue of Lgals1−/− and C57BL/6 wild-type control mice. Data fit Gaussian distribution, bars represent the mean expression for groups of 10 mice while error bars indicate the SEM. Data was obtained from 2 independent infection experiments, an asterisk indicates a statistically significant difference (p≤0.05) and “ns” means no significant difference (p>0.05) between galectin and wild-type control mice.

