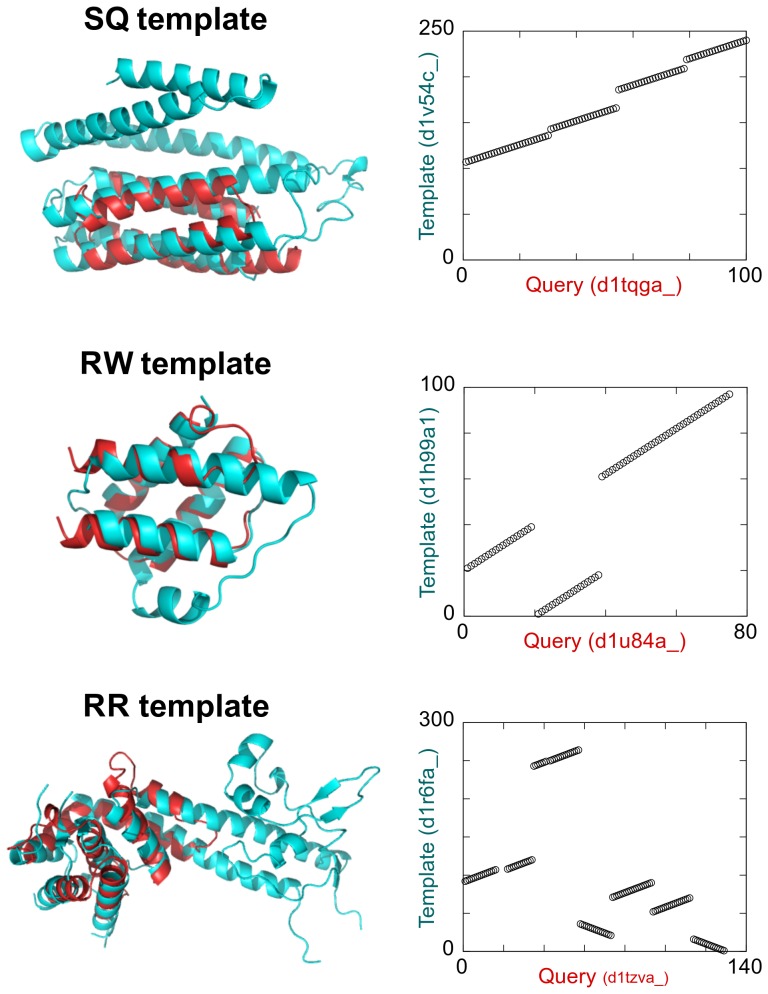
Figure 2. Typical examples of the SQ, RW, and RR templates.
The cartoon structures on the left present the superposition structures of a query (red) and the closest structure (cyan) to the query. The figures on the right are alignment plots, on which aligned residue pairs are represented as circles. The horizontal axis of the plot represents the residue number of the query protein, and the vertical axis represents that of the template.

