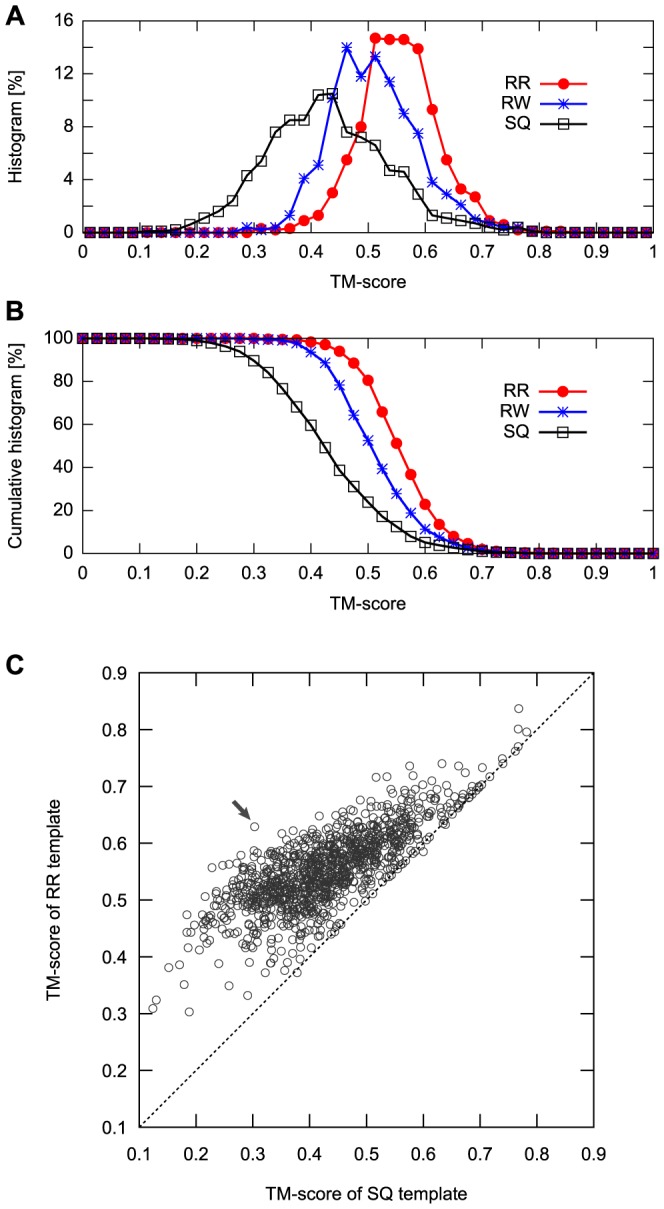
Figure 3. Comparison of the TM-scores among the best SQ, RW, or RR template and the corresponding query.

(A) The histograms of the TM-scores of the SQ, RW and, RR templates are represented as black, blue, and red lines, respectively. (B) The cumulative histogram of the target proteins with the TM-scores of SQ, RW, and RR templates that is equal to or greater than the abscissa. (C) The scatter plot of the TM-scores of the SQ template versus RR template. The horizontal axis represents the TM-scores of SQ template, and the vertical axis represents those of the RR template. The black arrow indicates the target displaying the largest difference of TM-score between the SQ and RR templates.
