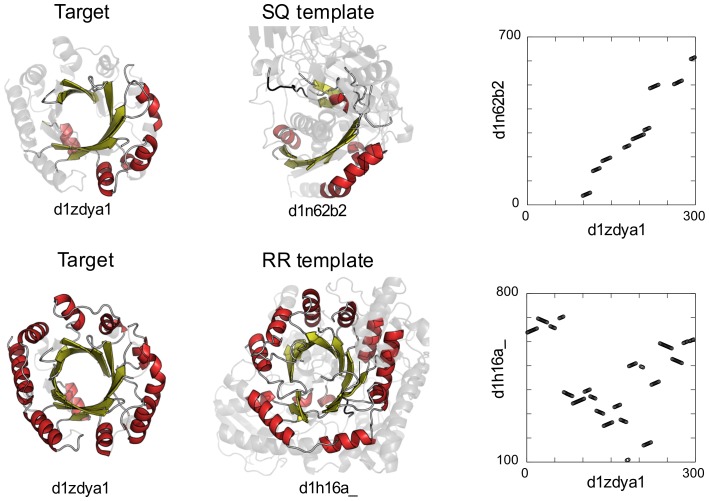
Figure 4. The SQ and RR templates of aromatic prenyltransferase.
The cartoon figures on the left represent the structure of aromatic prenyltransferase, which exhibited the largest difference in TM-score between the RR and SQ templates, and those in the middle present the SQ and RR template structures. In these figures, only structurally aligned regions are highlighted and colored. The graphs on the right are the alignments plots between the target and template.

