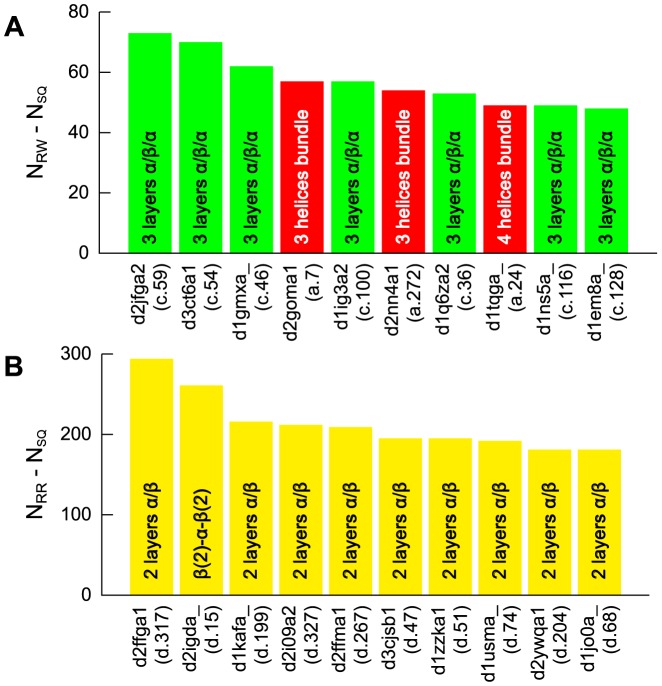
Figure 8. The top 10 SCOP folds having the largest numbers of structural neighbors identified by the RW (A) and RR (B) schemes.
Each bar represents a fold representative, and it is colored by SCOP class as follows: all- (red), all-
 (blue),
  /
/ (green),
  +
+ (yellow), and others (black). The height of the bar represents
  or
or  . The target proteins are ordered by their values of
  or
or  . For each target, the SCOP ID and SCOP fold ID are given under the bar. Short descriptions of each fold are also given in the bars.

