
Figure 12. Comparison of the TM-scores among the best SQ, RW, or RR template and the corresponding query.
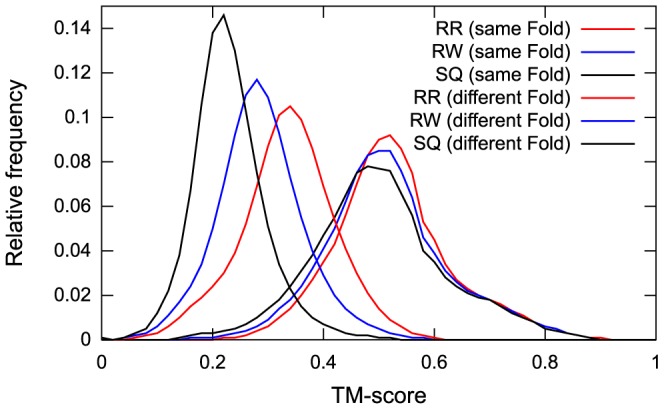
The histograms of the TM-scores of the SQ, RW, and RR templates are represented as black, blue, and red lines, respectively.
Official websites use .gov
A
.gov website belongs to an official
government organization in the United States.
Secure .gov websites use HTTPS
A lock (
) or https:// means you've safely
connected to the .gov website. Share sensitive
information only on official, secure websites.
The histograms of the TM-scores of the SQ, RW, and RR templates are represented as black, blue, and red lines, respectively.