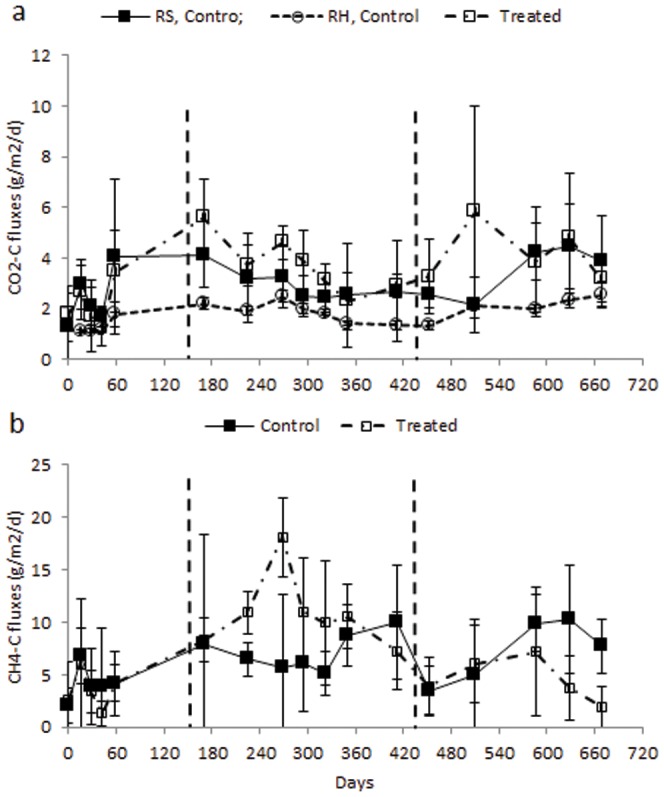
Figure 2. Mean (±95% CI) Carbon emissions.

a) CO2 fluxes of total sediment respiration (RS) (solid line with filled squares), heterotrophic respiration (RH) (dashed line with open circles) in control plots and CO2 fluxes from treated plots (broken line with open squares) and b) CH4 emissions in R. mucronata forest at Gazi bay Kenya. Vertical broken lines indicate periods when trees were girdled and cut in the treatment plots. Sampling for baseline, girdled and cut periods were done from June 2009 to August 2009 (84 days), December 2009 to May 2010 (189 days) and May 2010 to April 2011 (343 days), respectively. The controls and the treatment consisted of five replicates each.
