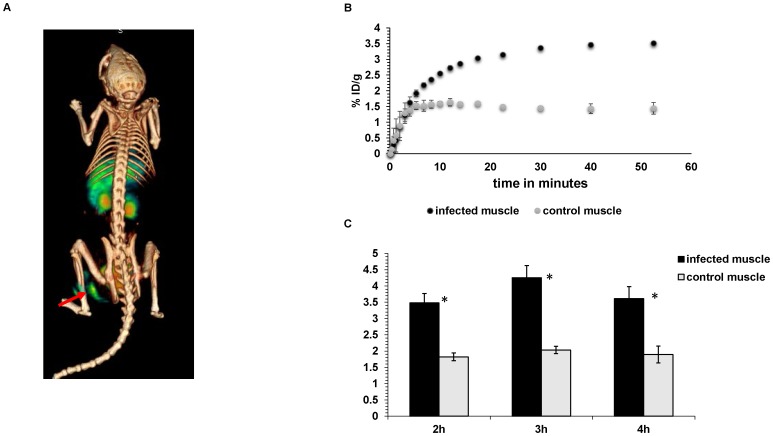
Figure 2. In vivo characterization of 6-[18F]-fluoromaltose.
A) 3D color map from a PET/CT scan of a mouse bearing E.coli induced infection on the left thigh (red arrow) 1 hr after tail-vein injection of 7.4MBq of 6-[18F]-fluoromaltose. B) Region of interest analysis (ROIs) from PET/CT images at the indicated time points (n = 4 for each time point) * indicates statistical significance with p<0.05. C) Time activity curve showing accumulation of 6-[18F]-fluoromaltose in the infected muscle (n = 3).

