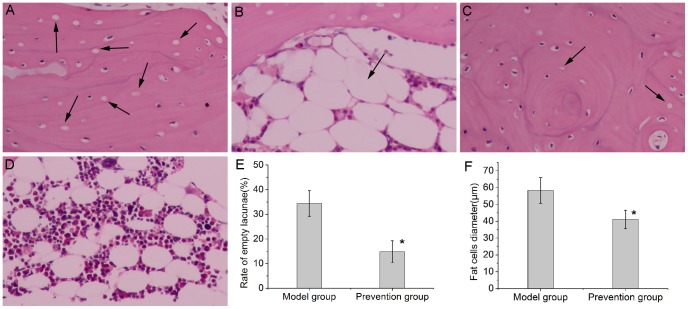
Figure 1. Histopathological observations (200×magnification).
(A). Obvious osteonecrosis was observed in the model group. Osteocytes in the bone trabeculae showed pyknosis and empty lacunae. (B). The diameter of fat cells in the marrow of the model group significantly increased. (C). In the prevention group, fewer empty lacunae were observed. (D). Compared with the model group, the diameter of fat cells in the prevention group decreased. (E and F). Bar graph shows the rate of empty lacunae and diameter of fat cells. Both the rate of empty lacunae and diameter of fat cells in the prevention group was significantly lower than that in the model group and the significance was statistically significant(P<0.05). The asterisk (*) shows statistically significant difference between the two groups. Empty lacunae and enlarged fat cells are shown by arrows.

