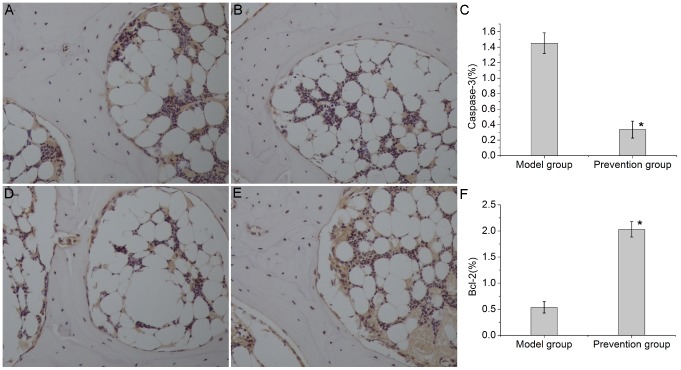
Figure 6. Immunohistochemical staining and semi-quantitative analysis of caspase-3 and Bcl-2(200×magnification).
Caspase-3 and Bcl-2 immunoreactivity were observed in the cell cytoplasm of cartilage, trabecular bone and bone marrow. (A). In the model group, relatively high immunoreactivity of caspase-3 was observed. (B). In the prevention group, weak immunoreactivity of caspase-3 was found. (C) and (F). Bar graphs represent the mean optical density of caspase-3 and Bcl-2 in bone marrow. Semi-quantitative analysis was based on at least 10 fields per section. The asterisk (*) shows statistically significant differences between the two groups. (D). In the model group, low immunoreactivity of Bcl-2 was observed. (E). In the prevention group, higher immunoreactivity of Bcl-2 was found.

