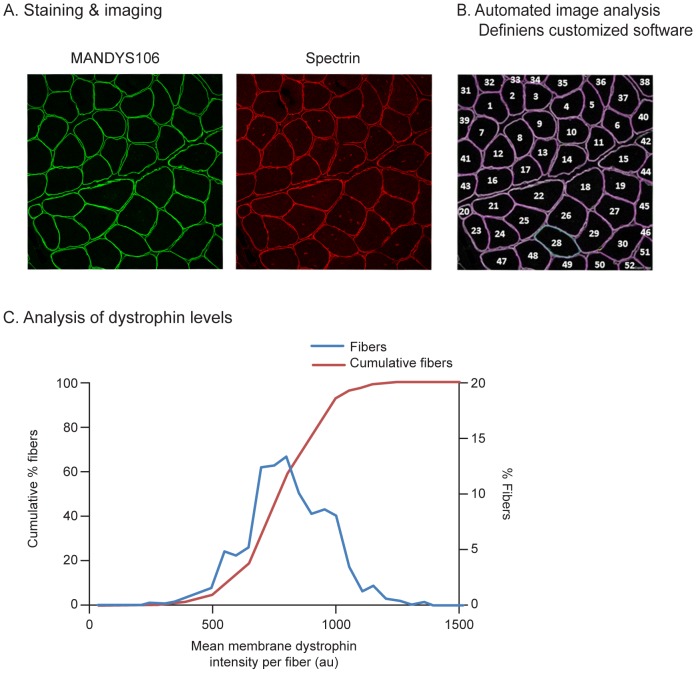
Figure 1. Immunofluorescence analysis of dystrophin intensities per fiber in a muscle fiber population.
A. Cryosections of a healthy control muscle sample (control 3, quadriceps muscle) co-stained with anti-dystrophin antibody MANDYS106 and an anti-spectrin antibody. The sections were imaged using a confocal microscope, with the green channel (Alexa488) showing dystrophin and the red channel (Alexa594) showing spectrin. B. Images were analyzed using customized Definiens software, which automatically identifies individual muscle fiber membranes using their spectrin signal and measures the membrane dystrophin intensity per muscle fiber. C. Dystrophin intensity distribution in muscle fiber population analyzed, shown as a regular histogram (blue line) or a cumulative histogram (red line). (au: arbitrary units).

