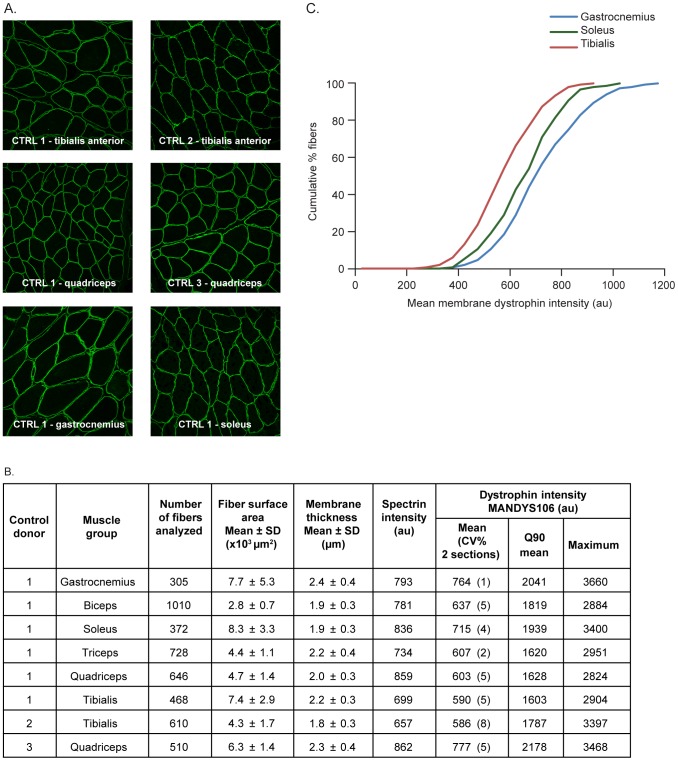
Figure 2. Dystrophin expression in healthy (non-DMD) control muscle samples from different muscle groups and different donors using MANDYS106.
Eight muscle samples were compared within one experiment: six muscle groups from one donor (control 1) and two muscle groups from two other donors (controls 2 and 3). Analysis was performed on two sections per sample; imaging was performed with microscope settings suitable for imaging control samples (1% laser intensity). A. Representative immunofluorescence images of different muscle groups from Controls 1–3. B. Summary of numbers of fibers analyzed per samples, morphology parameters (fiber cross-section surface area and membrane thickness), mean spectrin intensities and dystrophin intensity parameters (mean, Q90 mean and maximum) of all the samples analyzed. C. Dystrophin intensity distribution in the fiber populations (cumulative plots) of three different muscle groups analyzed for control 1. (au: arbitrary units; CV%: coefficient of variation of replicate sections; CTRL: control; DMD: Duchenne muscular dystrophy; SD: standard deviation).

