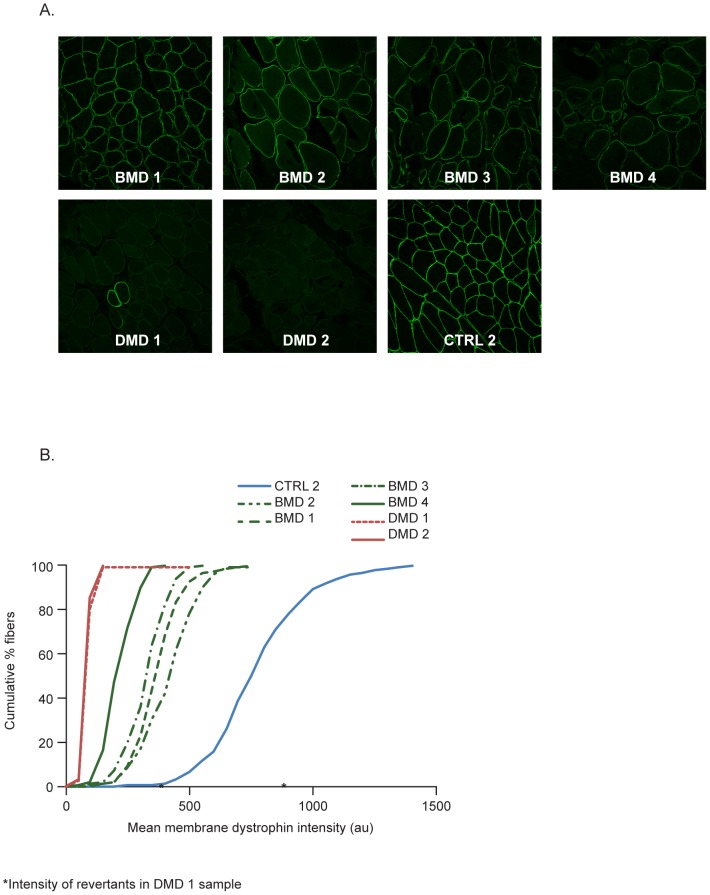
Figure 3. Dystrophin intensity in control muscle samples, and pre-treatment DMD and BMD muscle biopsies.
A. Representative immunofluorescence images (1 of 10 images) from the tibialis anterior muscle samples (from one control subject (CTRL2), two patients with DMD and four patients with BMD. Analysis was performed in the same experiment using the MANDYS106 antibody and ‘control’ imaging settings (1% laser intensity). B. Corresponding dystrophin membrane intensity distribution in the fiber populations analyzed (cumulative graphs). (au: arbitrary units; BMD: Becker muscular dystrophy; CTRL: control; DMD: Duchenne muscular dystrophy).

