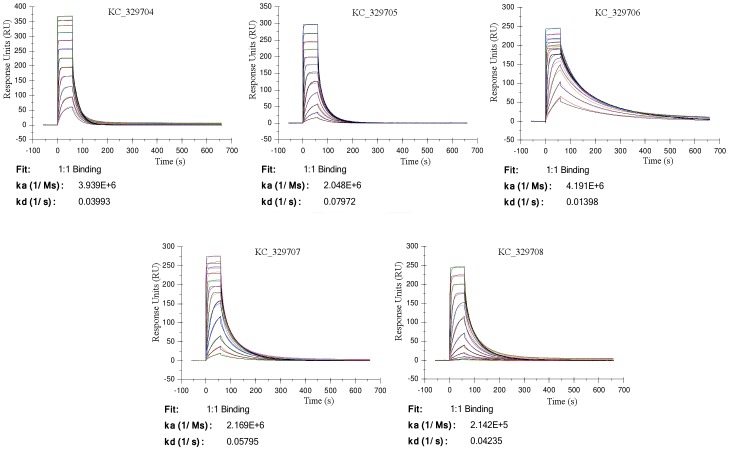
Figure 4. Surface plasmon resonance analysis to show specific binding of VHH and monoclonal antibody.
Sensorgrams obtained after injection of purified VHHs (KC329704–329708) at concentrations of 8, 4, 2, 1, 0.5, 0.25, 0.125, 0.063, 0.0313, 0.0156, 0.00781, 0.0039 µM.

