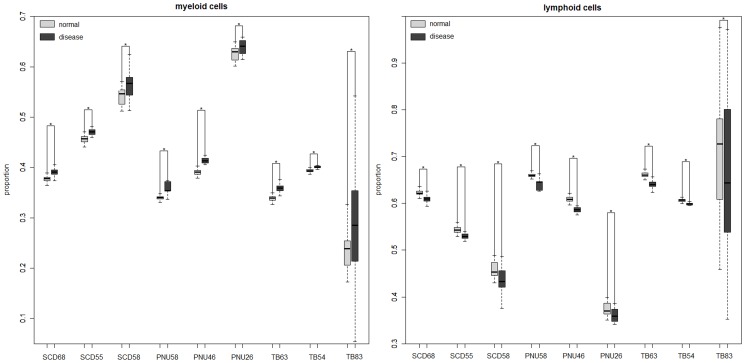
Figure 2. Boxplot of proportions of myeloid and lymphoid cells in inflammation-associated pulmonary disease and control PWB samples.
The estimated proportions of myeloid and lymphoid cells in sarcoidosis, pneumonia and tuberculosis and healthy PWB samples for each dataset. * denotes statistically significant differences (P<0.05). Abbreviations are same as in Table 1.

