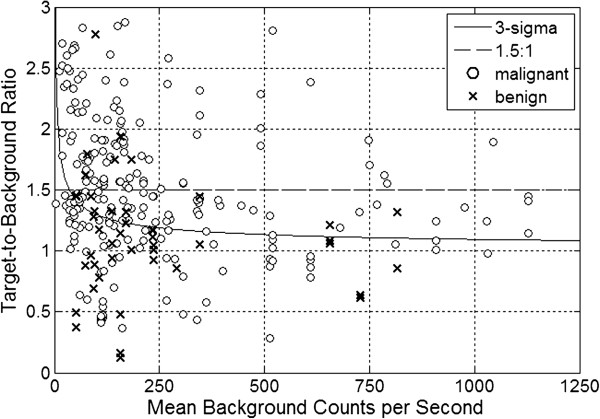
Figure 2.

Plot of the target-to-background ratio and mean background count rate for those 291 of the 401 gamma detection probe measurement data sets that were limited to a mean background count rate range of less than 1250 counts per second. Malignant 18F-FDG-avid tissue sites are shown as (o) and benign18F-FDG-avid tissue sites are shown as (x). The thresholds for probe positivity, expressed as target-to-background ratios, are graphed as a function of the mean background count rate. The ratiometric threshold criteria of 1.5-to-1 is shown as a dashed line and the three-sigma threshold criteria is shown as a solid line curve.
