
Figure 2. Nuclear HER4 localisation is induced in vitro and in vivo after trastuzumab treatment.
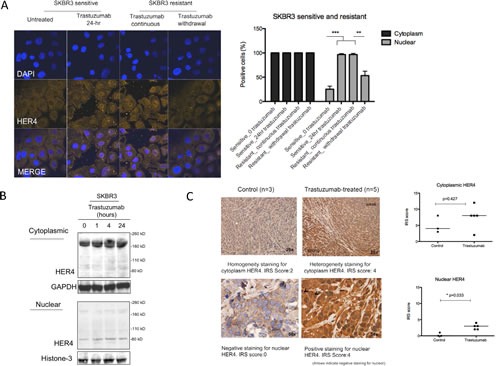
(A) Left, representative confocal images from sensitive and acquired resistant SKBR3 cells treated with 40μg/ml trastuzumab are shown. Right, a graph shows the percentage of positive cells stained with HER4-Alexa Fluor 546 at cytoplasmic and nuclear localisation. Means ± SD from three independent experiments are shown in the graph. 1-way ANOVA test with Bonferroni's multiple comparisons was applied to determined significant differences between the groups (**p<0.01, ***P<0.001). (B) Western blot analysis was performed on the cytoplasmic and nuclear fractions of SKBR3 cells isolated using NE-PER Nuclear and Cytoplasmic Extraction kit (Thermo Scientific). After cell fractionation, GAPDH and Histone-3 levels were used as the loading control for cytoplasm fraction and nuclear fraction respectively. (C) Left, HER4 staining by IHC in untreated and trastuzumab treated BT474 xenografts. The xenografts consist of mice treated with either trastuzumab or control for two weeks [24]. HER4 expression was scored semiquantitatively using the immunoreactive score (IRS) as described in the methods. Right, the cytoplasmic and nuclear HER4 scorings of trastuzumab-treated and the control groups are presented in a graph. Mann-Whitney test was used to determine the difference in median IRS scores between the untreated and trastuzumab-treated group. The statistical significance was denoted as * p<0.05.