
Figure 6. Neratinib prevents nuclear HER4 translocation induced by trastuzumab in vitro and in vivo.
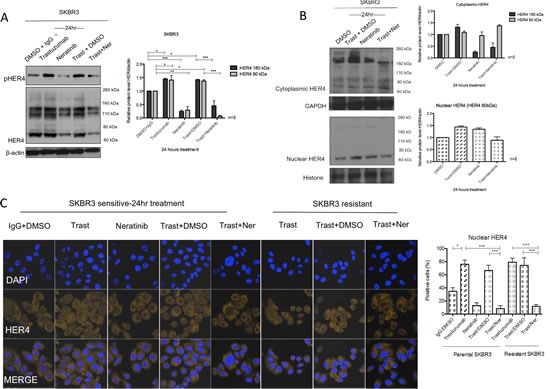
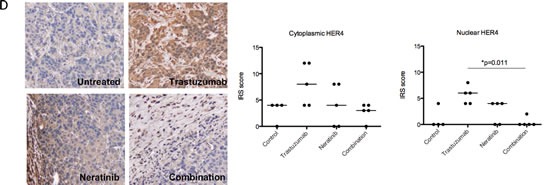
(A) SKBR3 cells were treated with 100 nM neratinib or/and 40μg/ml trastuzumab for 24 hours before western blot analysis for the indicated proteins. (B) Western blot analysis was performed on the cytoplasmic and nuclear fractions of SKBR3 cells after treatments in (A). On the left panels, the representative blots are shown. The right panels show a relative quantification of HER4 and pHER4 from 2 independent experiments using Image J software. Although multiple independent experiments were done, only two experiments provided adequate quality of HER4 immunoblot for quantification. (C) Sensitive and resistant SKBR3 cells were treated with 100 nM neratinib and/or 40μg/ml trastuzumab before being fixed for confocal microscopy. Representative confocal images from different treatment conditions are shown on the upper panel. The right panel shows the percentage of positive cells stained with HER4-Alexa Fluor 546 at nuclear localisation. Means ± SD from three independent experiments are shown in the graph. 1-way ANOVA test with Bonferroni's multiple comparisons was applied to determined significant differences between the groups (*p<0.05, ***p<0.001).(D) BT474 xenografts were treated with vehicle control, neratinib, trastuzumab or their combination [28] and the tumour slides were stained for HER4 expression using IHC. Representative tumour sections from formalin-fixed, paraffin embedded tumour tissues of animals receiving different treatments are shown in the left panels. The IRS scores of HER4 immunohistochemical staining of cytoplasmic and nuclear localisation of the tumours are shown in the right panels. Kruskal-Wallis with Dunn's multiple comparisons test was used to determine the difference in median IRS scores between the treatment groups (*P<0.05).