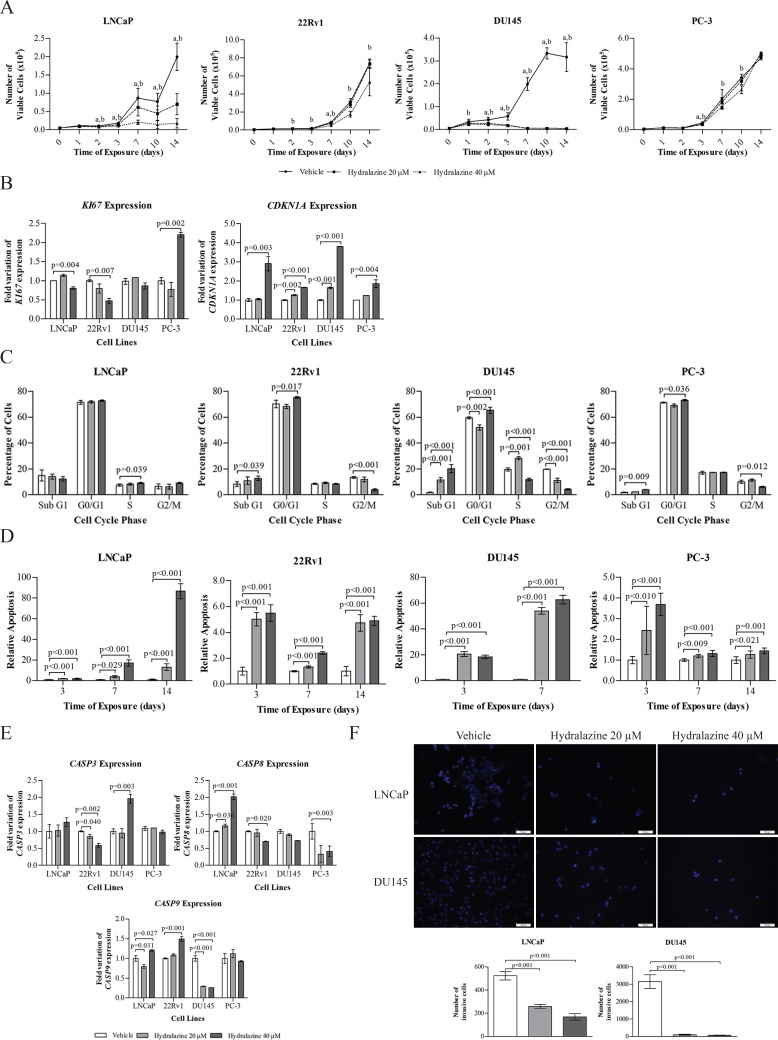
Figure 1. Phenotypic effects induced by hydralazine in PCa cell lines.
(A) Cell viability in LNCaP, 22Rv1, PC-3 and DU145, exposed to hydralazine and drug vehicle, at days 0, 1, 2, 3,7,10, and 14, measured by MTT assay. (a) Statistically significant differences were observed between vehicle and 20 μM hydralazine, and (b) vehicle and 40 μM hydralazine. (B) mRNA expression of Ki67 and CDKN1A in LNCaP, 22Rv1 and PC-3 after 14 days and DU145 after 3 days of exposure to hydralazine. (C) Cell cycle evaluation after 14 days of hydralazine exposure in LNCaP, 22Rv1 and PC-3 and three days of hydralazine exposure in DU145. (D) Effect of hydralazine exposure in early apoptosis of PCa cell lines, measured at days 3 and 7 in all PCa cell lines and at day 14 in LNCaP, 22Rv1 and PC-3, with a phosphatidylserine based assay. (E) CASP3, CASP8 and CASP9 mRNA expression in LNCaP, 22Rv1 and PC-3 after 14 days and DU145 after 3 days of exposure to hydralazine. (F) Effect of hydralazine exposure on the invasion potential of LNCaP and DU145 (upper – immunofluorescence images of vehicle and hydralazine exposed cells, counterstained with DAPI; down – graphic representation of the total number of invasive cells). All data are presented as mean of three independent experiments ± s.d.

