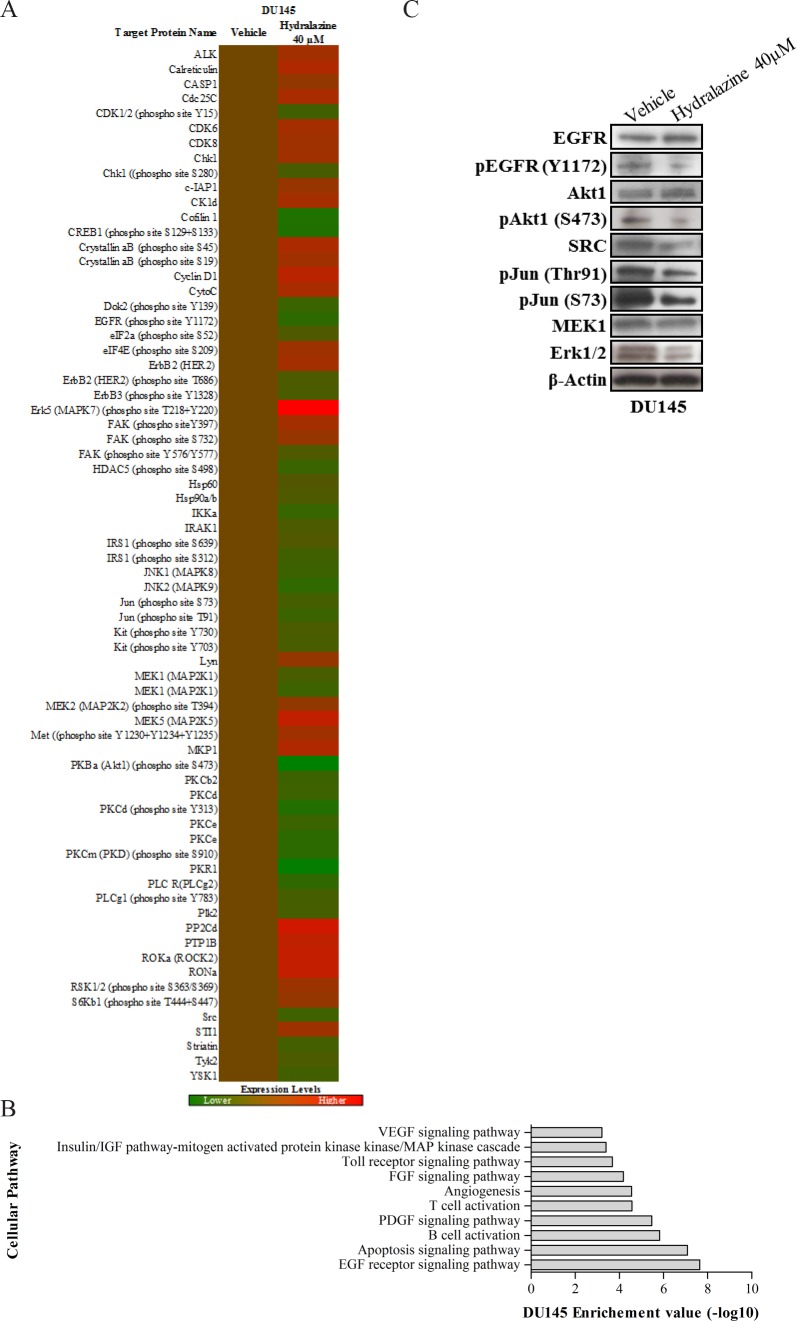
Figure 7. EGF signaling pathway deregulation in DU145 cells after hydralazine exposure.
(A) Protein expression heat map of DU145exposed to 40 μM hydralazine (red: protein overexpression; green: protein reduced expression. Experiments were performed in triplicate. (B) Altered cellular pathways identified by DAVID software. EGF receptor pathway showed the lowest p value (10−8). (C) Western Blot validation of disrupted targets of EGF receptor pathway in DU145 cell line upon hydralazine exposure. β-Actin was used as loading control

