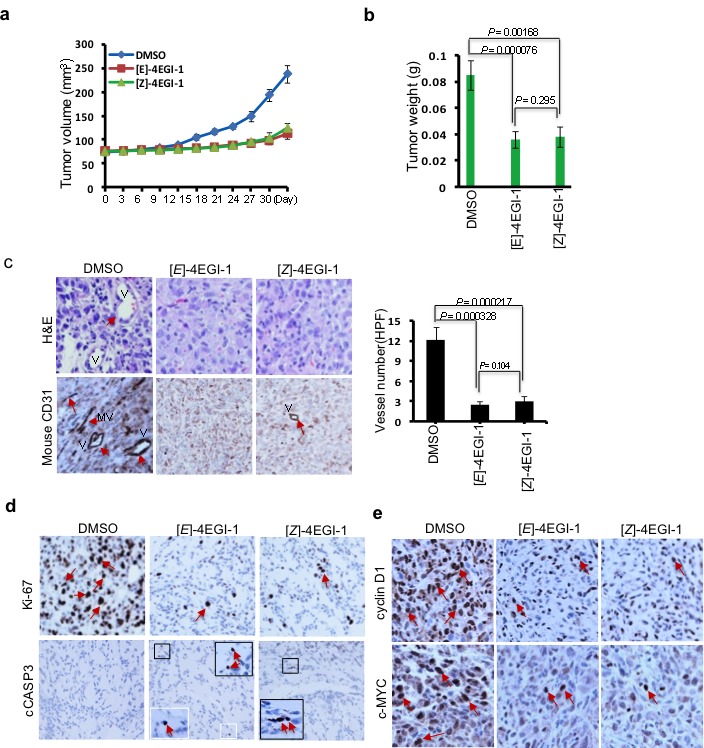
Figure 4. 4EGI-1 suppresses breast CSC tumor growth and tumorangiogenesis in vivo.

(a) The graph represents average tumor volumes of each group over time. The average tumor volume from DMSO treated group increased from 74.30±2.43 to 237.4± 18.6mm3, whereas that from [E]-4EGI-1 treated group increased from 76.87±1.96 to 113.2±11.4 mm3, and that from [Z]-4EGI-1 increased from 75.01±1.75 to 123.9 ±10.8 mm3. Bar represents tumor volume mean ± SD (n=5 mice, t-test, p<0.001). (b) Average tumor weights of each group. The average tumor weight from DMSO treated group is 0.08524±0.01145g, whereas that from [E]-4EGI-1 treated group is 0.036± 0.00618g and that from [Z]-4EGI-1 treated group is 0.038±0.0077g (mean ± SD, n=5, t-test). (c) Representative H&E staining (top panels) and immunohistostaining (bottom panels) images of anti-mouse CD31 antibody in tumor cross-sections. Left panel: Statistical data from immunohistostaining analyses expressed as average tumor vessel number per high performance field (HPF, 200×) with 12.2±1.92 vessel/HPF in DMSO treated tumor group, 2.4±0.54 vessel/HPF in [E]-4EGI-1treated tumor group, and 3±0.7 vessel/HPF in [E]-4EGI-1treated tumor group (mean ± SD, n=6, t-test). Arrows indicate vessels and microvessels. V: vessels; MV: microvessels. (d) Representative immunohistostaining images of tumor cross-sections with anti-Ki-67 and anti-cleaved Caspase 3 (cCASP3) antibodies. Arrows indicate signals of Ki-67 or cCASP3. Framed areas show the enlarged images of cCASP3 signals. (e) Representative immunohistostaining images of cross-sections with anti-cyclin D1 and anti-c-MYC antibodies. Arrows indicate signals of cyclin D1 or c-MYC.
