
Figure 2. Docking studies and binding site analyses of AV-1 in GAB.
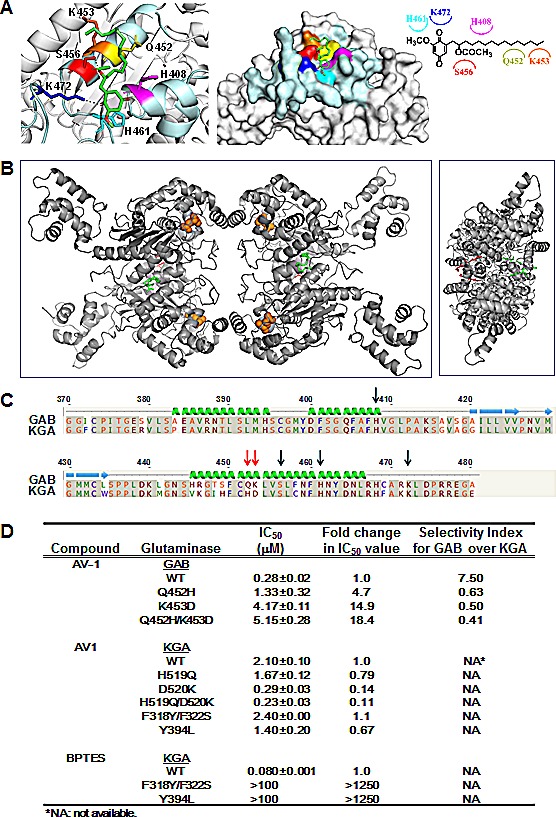
(A) Docking simulation of AV-1 binding site in GAB. Magenta: H408 histidine; Yellow: Q452 glutamine; Orange: K453 lysine; Red: S456 serine; Cyan: H461 histidine; Blue: K472 lysine; Dashed lines: hydrogen bond interactions. AV-1 chemical structure was shown with interacted residues of GAB. (B) Overview of the proposed association of AV-1 in GAB tetramer. Left panel presents a top view and right panel a side view. AV-1 is presented in red and green stick figure for clarity, and the glutamate molecules are shown as orange spheres. (C) Primary sequence alignment of human KGA and human GAB around the simulated AV-1 binding site. Key interactive residues are denoted with arrows. Mutation sites for selectivity of GAB over KGA are denoted with red arrows. (D) IC50 values and selectivity index of AV-1 & BPTES for GAB or KGA wild-type and mutant enzymes. Mutations at residues Q452 and K453 of GAB into corresponding residues of KGA created GAB mutants GAB_Q452H, GAB_K453D, and GAB_Q452H/K453D. Mutations at residues H519 and D520 of KGA into corresponding residues of GAB created KGA mutants KGA_H519Q, KGA_D520K, and KGA_ H519Q/D520K. Mutations at residues F318/F322 and Y394 of KGA into corresponding residues of GAB or bacterial glutaminase created KGA mutants KGA_F318Y/F322S and KGA_Y394L [3].