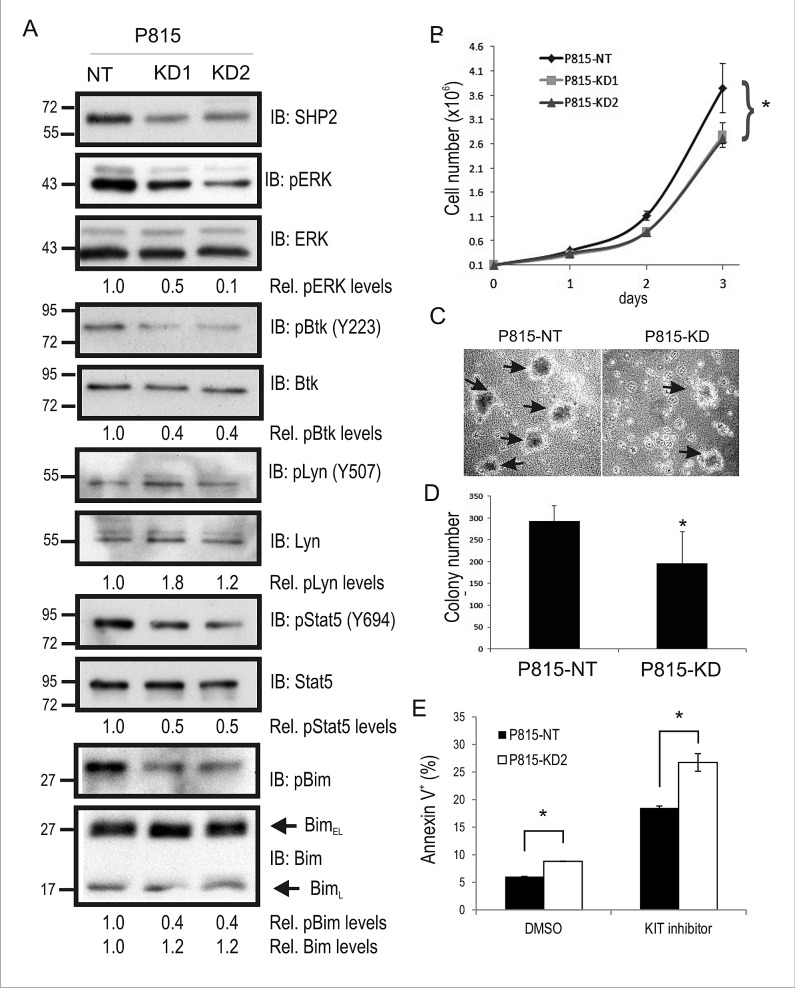
Figure 1. SHP2 promotes mouse mastocytoma cell growth, and colony formation.
A. Lysates from P815 cells transduced with non-targeting (NT) control shRNA (P815-NT), SHP2 shRNA1 (P815-KD1), and SHP2 shRNA2 (P815-KD2) were subjected to IB with SHP2, pERK, ERK, pY223-Btk, Btk, pY507-Lyn, Lyn, pY694-Stat5, Stat5, p-Bim, and Bim antisera. Densitometry values are shown below panels for relative phosphorylation levels (phospho-specific/total) or protein levels (Bim/ERK). Positions of relative mass markers in kilodalton are shown on left. B. P815-NT, -KD1 and –KD2 were seeded in triplicate wells (1×10⁵) on day 0, and counted daily until day 3. Graph depicts the average cell number (mean ± SD; triplicate samples) for each time point (* indicates significant difference between NT and KD1 or KD2 cells, p <0.05). C. Representative phase contrast images for P815 colonies (shown by arrows) formed in semisolid methylcellulose medium at day 8 for P815-NT and P815-KD cells. D. Graph depicts average colony numbers (mean ± SD) for P815-NT and P815-KD cells in methyl cellulose medium at day 8 (triplicate samples; * indicates significant difference between NT and KD, p <0.05). E. P815-NT and P815-KD cells were treated with vehicle (DMSO) or KIT inhibitor (SU11652, 250 nM) for 18 hours prior to AnnexinV staining and analysis by flow cytometry. Graph depicts percent Annexin V positive cells (mean ± SD; triplicate samples; * indicates significant difference between NT and KD2 cells, p <0.05). All results are representative of at least 3 separate experiments.

