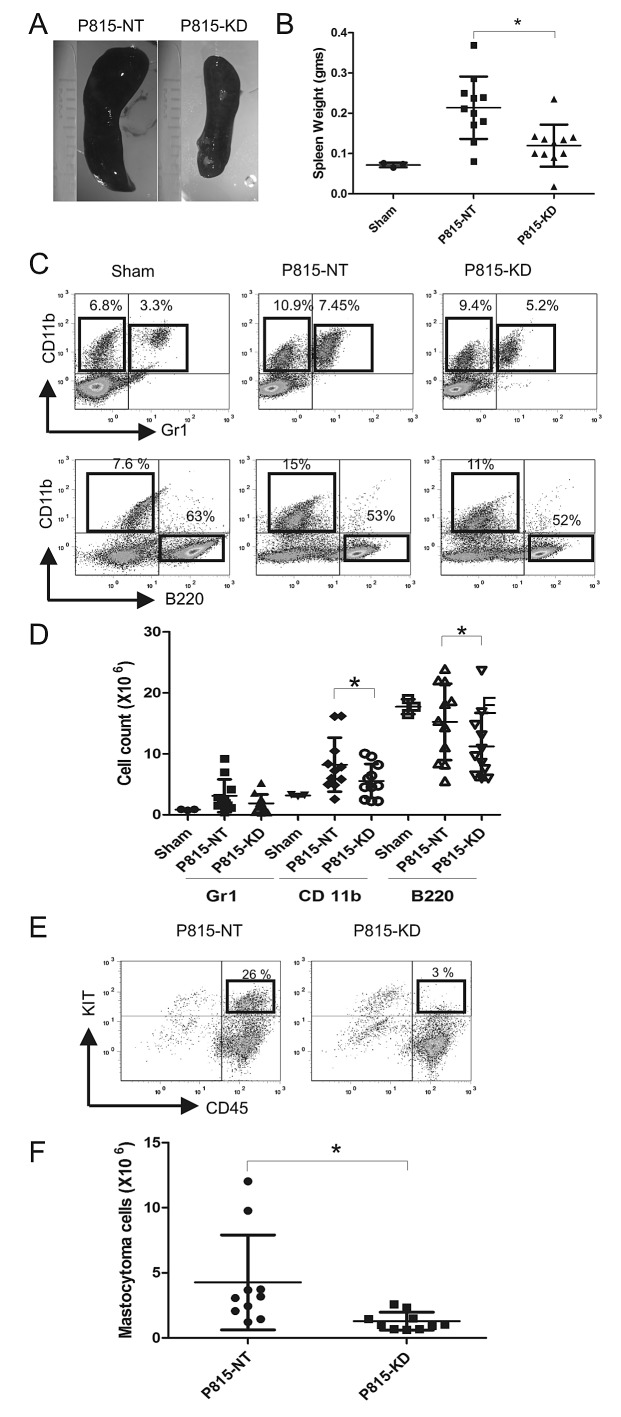
Figure 2. SHP2 silencing prevents splenomegaly in a mouse model of SM.
A. Representative images of spleens isolated from DBA/2 mice at day 13 following retro-orbital injection of saline (sham), or P815-NT cells, or P815-KD cells (5 × 10³ in 100 μl; 3-4 mice/group; 3 experiments). B. Graph depicts spleen weights from saline-injected sham mice (n=3), or mice injected with P815-NT or P815–KD cells (n=11) at day 13 (mean ± SD; * indicates significant difference between groups, p <0.05). C. Splenocytes isolated from mice described above were analyzed by flow cytometry. Representative histograms are shown for splenocytes stained with FITC-Gr1/PE-CD11b/PEcy5-B220, with mean values shown for single and double positive populations (n=3; results are representative of 3 independent experiments). D. Graph depicts absolute cell numbers (x106) for Gr1+, CD11b+, and B220+ cells in spleen from mice described above (* indicates significant difference between NT and KD, p <0.05). E. Representative histograms are shown for splenocytes stained with PE-KIT/PEcy5-CD45, with mastocytoma cells identified as double positives, from mice described above. F. Graph depicts the absolute mastocytoma cell numbers in spleen (mean ± SD; n=10; * indicates significant difference between NT and KD, p <0.05).

