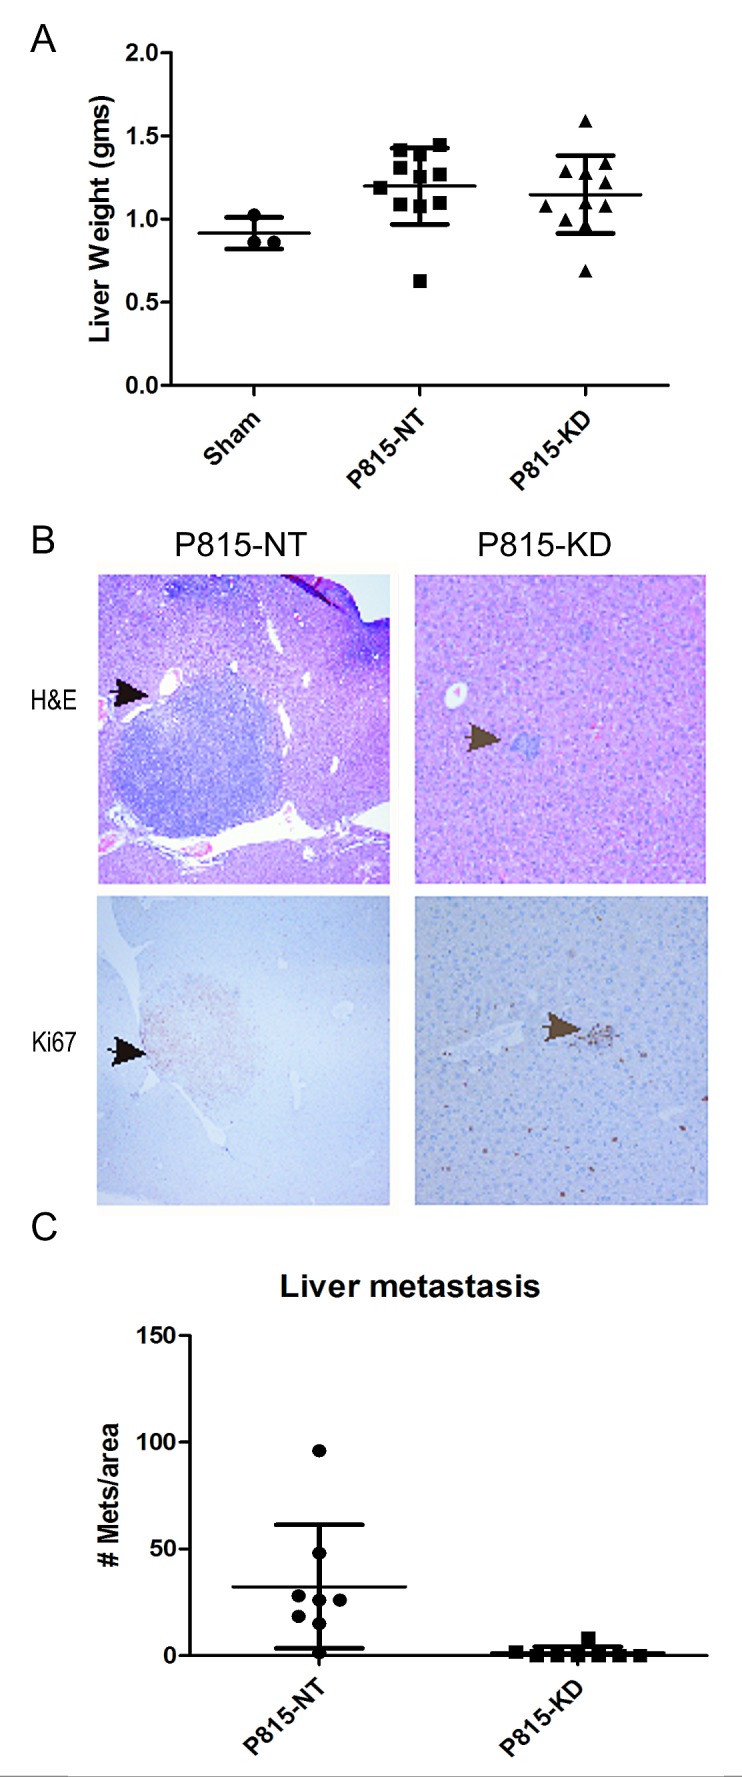
Figure 5. SHP2 silencing prevents mastocytoma tumor growth in liver.

A. Graph depicts day 13 liver weights from mice injected with saline (sham, n=3), P815-NT cells, or P815–KD cells (mean ± SD; n=11). B. Livers from mice injected as described above were formalin fixed, paraffin embedded, and sections were stained with H&E and by immunohistochemistry using Ki67 antisera. Representative micrographs are shown for H&E (upper panels) and Ki67 staining (lower panels; arrows denote mastocytomas and mitotic figures). C. Graph depicts quantification of liver metastases per unit area of liver section (mean ± SD; n=8 from 3 separate experiments; * indicates significant difference between NT and KD, p <0.05).
