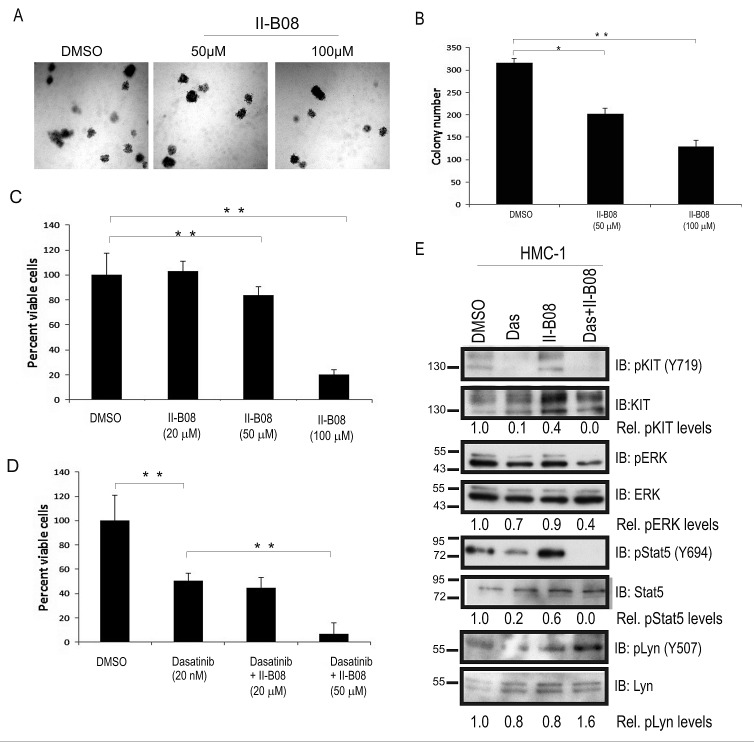
Figure 6. SHP2 phosphatase activity is required for sustaining growth and survival of HMC-1 cells.
A. Representative phase contrast images depicting the colony growth of HMC-1 cells in methyl cellulose media at day 8 in presence of DMSO and II-B08 (50 and 100 μM). B. Graph depicts average colony numbers (mean ± SD) for HMC-1 cells treated with DMSO or indicated concentrations of II-B08 in methyl cellulose medium at day 8 (triplicate samples; * and ** indicates significant difference between treatments at p<0.05 and p <0.01, respectively). C. HMC-1 cells were treated with DMSO or II-B08 (20, 50 or 100 μM) for 72h. Graph depicts the percentage of viable cells based on alamar blue assay (** indicates significant difference between DMSO and II-B08 treated cells, p <0.01). D. HMC-1 cells were treated with either DMSO, Dasatinib (50 nM), or Dasatinib (50 nM) plus II-B08 (20 or 50 μM) for 72h. Graph depicts the percentage of viable cells based on alamar blue assay (** indicates significant difference between treatment groups, p <0.01). E. HMC-1 cells were treated either with vehicle (DMSO), Dasatinib (5nM) or SHP2 inhibitor II-B08 (50 μM alone or Dasatinib (50nM) plus II-B08 (50 μM) for 4 h prior to lysate preparation and IB with pY719-Kit, Kit, pERK, ERK, pY694-Stat5 and Stat5, pY507-Lyn, and Lyn antisera. Densitometry values are shown below panels for relative phosphorylation levels (phospho-specific/total). Positions of relative mass markers in kilodalton are shown on left.

