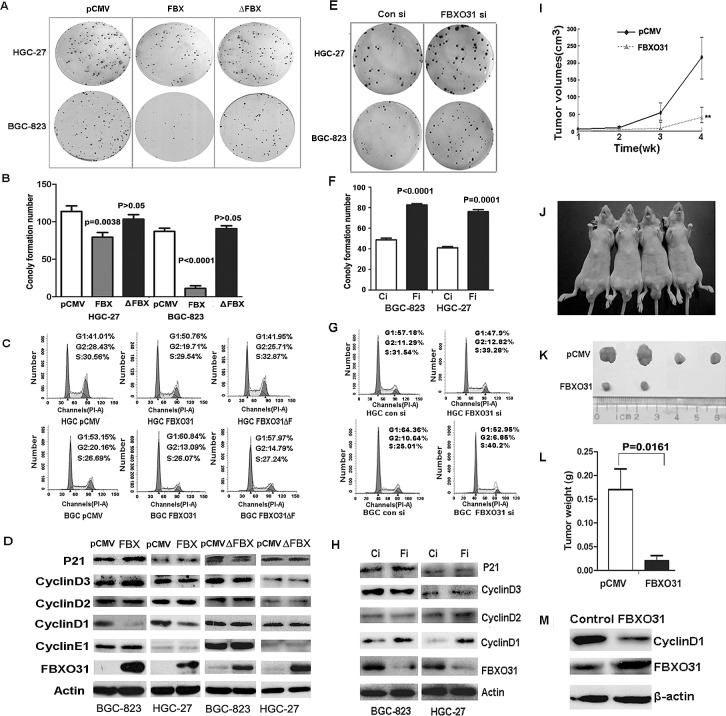
Figure 2. FBXO31 inhibited the colony formation and induced G1-phase cell cycle arrest in vitro and inhibited the tumor formation ability in vivo.
pCMV: the control vector; FBX: the vector expressing wild-type FBXO31; ΔFBX:the vector expressing mutant FBXO31.Ci:Control siRNA; Fi:FBXO31 siRNA.(A) The clonogenic potentials in the gastric cancer cells transfected with FBXO31 vector were assessed. The representative results were shown. (B)The colony formation number was analyzed in the cells transfected with different vector. Data, mean±SD. (C) The cell cycle distribution was analyzed by flow cytometry in the gastric cancer cells transfected with different vector. (D) Expression of the cell cycle regulators was determined with western blot. (E) The clonogenic potentials in the cells transfected with control siRNA and FBXO31 siRNA were assessed. The representative results were shown. (F) The colony formation number was analyzed in the gastric cancer cells transfected with control siRNA and FBXO31 siRNA. Data, mean±SD. (G) The cell cycle distribution was analyzed by flow cytometry in the gastric cancer cells transfected with control siRNA and FBXO31 siRNA. (H) Expression of the cell cycle regulators was determined with western blot in the cells transfected with control siRNA and FBXO31 siRNA. (I) The volumes of the subcutaneous tumors were measured weekly with a vernier caliper after implantation. (J)The nude mice were subcutaneously injected with BGC-823 cells transfected with pCMV (left) and FBXO31 (right) expression vector in the two flanks region. After 4 weeks, the nude mice were sacrificed.(K)The images of the dissected tumors are shown. A ruler is used to indicate the size of the tumor. (L)The tumor weight with different transfection was shown. Data, mean ±SD. (M) The total protein was extracted from the subcutaneous tumor tissues of the control groups and FBXO31 overexpression group. The protein levels of FBXO31 and cyclinD1 were determined with western blot. β-actin was used as the loading control.

