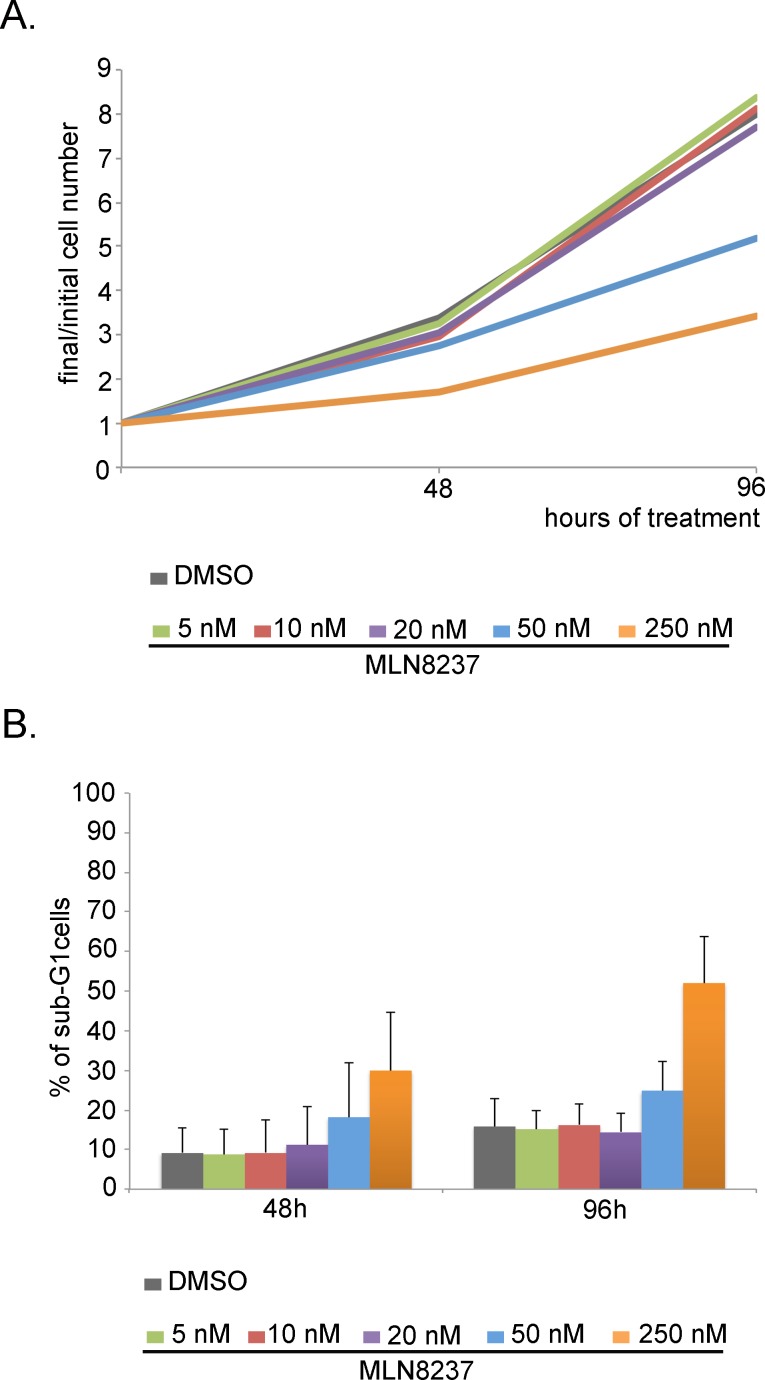
Figure 10. Dose-dependent effects of MLN8237 on cell growth and viability.
A. Cells were counted after 48 and 96 hours from MLN8237 treatment start. Values represent the increase in the number of cells respect to t=0h (3 independent experiments). B. The percentage of sub-G1 cells in MLN8237-treated cultures, detected by FACS analysis, is shown in the histograms (3 experiments). s.d. are shown.

