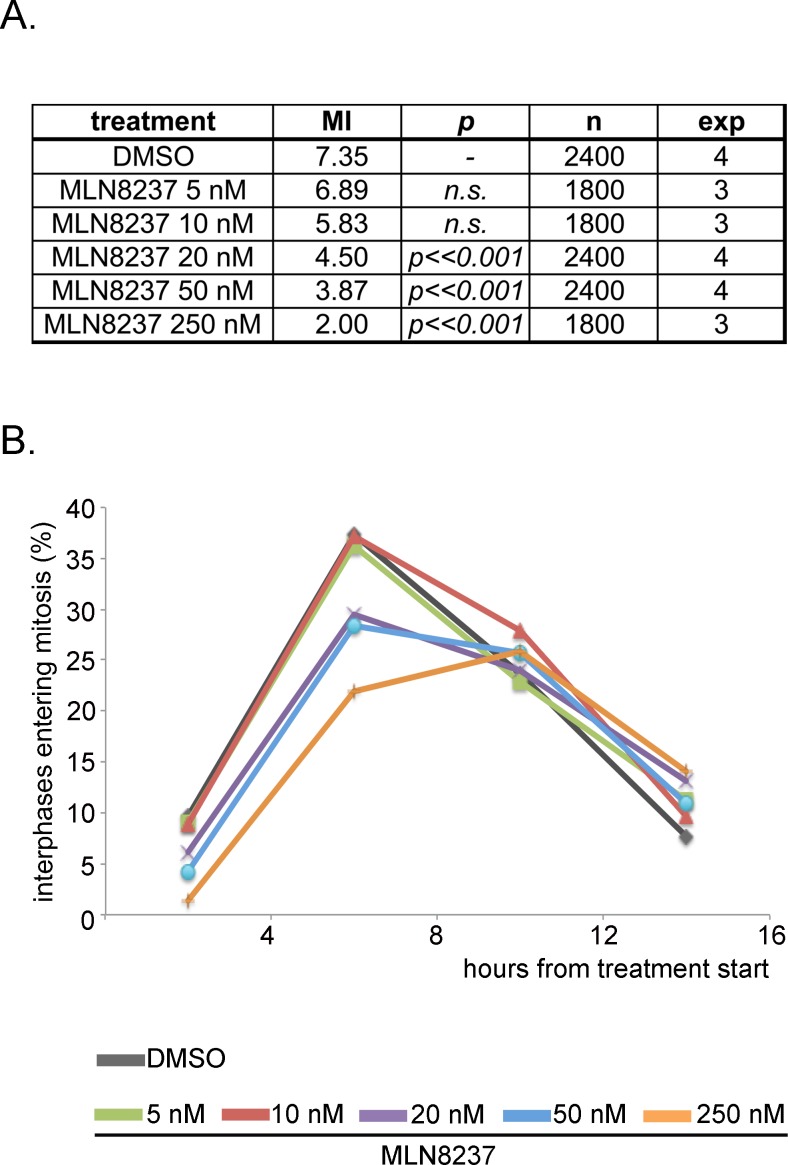
Figure 2. MLN8237 delays entry into mitosis.
A. Mitotic index (MI) from control (DMSO) and MLN8237-treated cultures (protocol as in Figure 1A), as assessed by DAPI (DNA) and alpha-tubulin (spindle) staining. p values (χ2 test) relative to control cultures, number of scored cells (n) and of independent experiments (exp) are indicated. B. Control (DMSO) and MLN8237-treated cultures were recorded by time-lapse imaging from the treatment start for the following 16 hours. The graph shows the percentage of interphases entering mitosis during the recording period; results are grouped in 4-hours intervals. 250 recorded interphases in 3 experiments for each condition.

