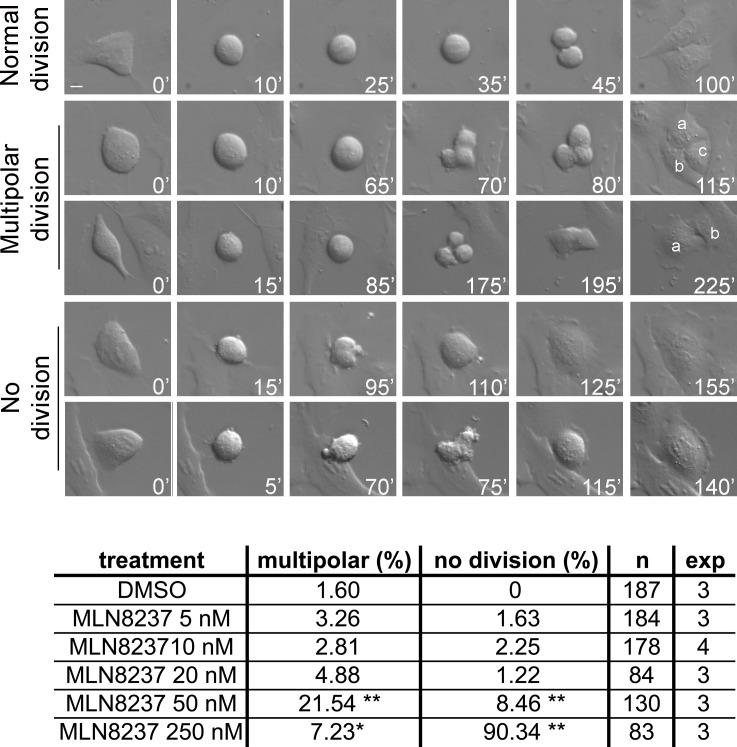
Figure 5. Time-lapse analysis of MLN8237-treated mitoses reveals multipolar and “no division” phenotypes.
Cultures treated as in the protocol in Figure 3 were recorded by time-lapse from treatment start for the following 24 hours. DIC images were acquired with a 40x objective every 5 minutes; representative single photograms are shown; time from round-up is indicated. First row: normal mitosis; second and third rows: multipolar mitoses (a, b and c indicate daughter cells); fourth and fifth rows: mitoses passing directly from prometaphase to defective interphase, with (lower) or without (upper) a “blebbing” phase. Defects are quantified (%) in the table below; number of recorded mitoses (n) and independent experiments per condition are indicated. *: 0.01<p<0.02; **: p< 0.001, χ2 test. Scale bar: 10 μm.

