
Figure 5. Silencing of STAT3 increases latency and decreases growth of primary breast tumors.
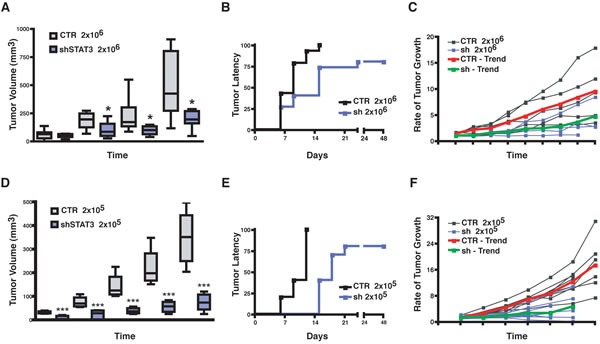
(A) Graph reports the volume (mm3) of primary tumors derived from injection of 2×10⁶ MDA-MB-231 control (CTR) or STAT3 silenced (sh-STAT3) cells in thoracic mammary fat pads of nude mice (2 MFP/mouse) in 50 μl Matrigel/PBS (1:1). (B) Graph reports the time dependent appearance of primary tumors derived from injection of 2×10⁶ MDA-MB-231 control (CTR) or STAT3 silenced (sh-STAT3) cells in the nude mouse thoracic mammary fat pads (2 MFP/mouse) in 50 μl Matrigel/PBS (1:1). (C) Graph reports the rate of tumor growth, independently from the time of appearance, in mice described in (A). Values are expressed as ratio of the tumor volume over the value of 20 mm3, considered as cut off. The red and the green lines represent the trend of growth of the MDA-MB-231 CTR and sh-STAT3, respectively. (D) Same as in (A), but injecting 2×10⁵ MDA-MB-231 (CTR) or STAT3 silenced (sh-STAT3) cells, in place of 2×10⁶ cells. (E) Same as in (B), but injecting 2×10⁵ cells. (F) Same as in (C), but injecting 2×10⁵ cells. In all graphs, statistical significance was calculated using the Student's t-test. One asterisk (*) indicates a p value ≤ 0.05, two asterisks (**) a p value ≤ 0.01 and three asterisk (***) a p value ≤ 0.005.