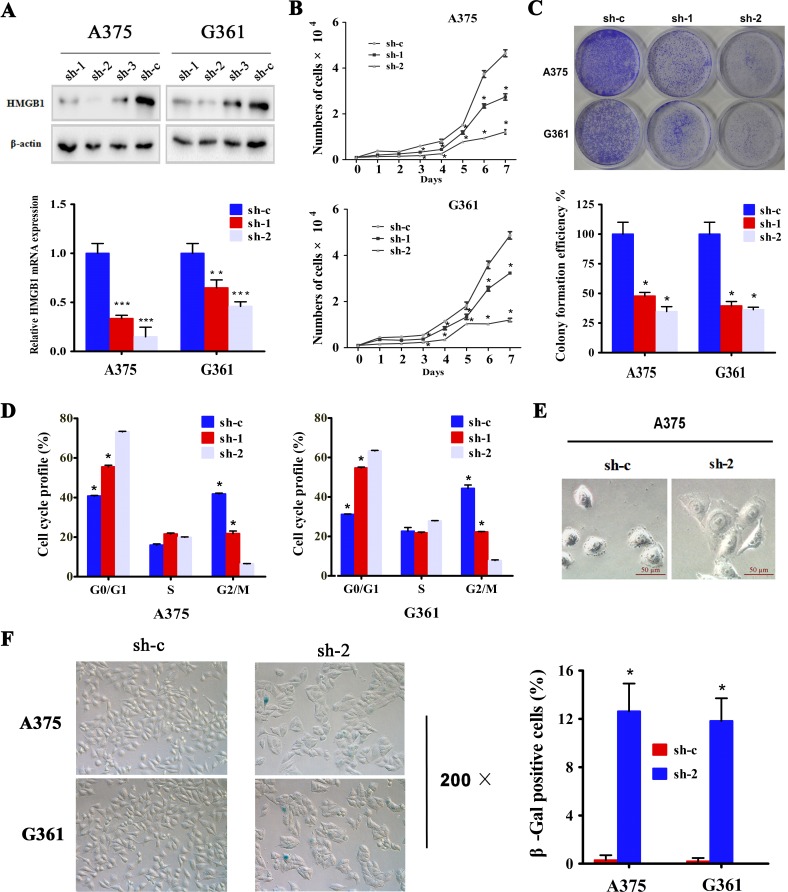
Figure 2. Downregulation of HMGB1 in melanoma cells induced inhibition of cell proliferation, cell cycle arrest and senescence.
(A) A375 and G361 cells were transfected with three independent shRNA constructs against HMGB1 (sh-1, sh-2 and sh-3) or control shRNA (sh-c). The protein levels of HMGB1 were analysis by immunoblot (upper panel), and the mRNA levels of HMGB1 were analysis by qRT-PCR (lower panel). Bars, SD; **p<0.005,***p<0.0005. (B) Growth curve of A375 or G361 expressing shRNA HMGB1 (sh-1 or sh-2) or the control shRNA (sh-c) was determined. The numbers were mean ± SD from three experiments performed in triplicate. Bars, SD; *p<0.05. (C) Cells as in B were subjected to colony formation assay. Representative colony images of A375 and G361 are shown (upper panel). The bar chart shows a quantitative analysis of the colony formation assay (lower panel). The numbers were mean ± SD from three experiments performed in triplicate. Bars, SD; *p<0.05. (D) A375 and G361 expressing shRNA targeting HMGB1 (sh-1 or sh-2) or control (sh-c) were labeled with BrdU 30 min before harvesting and cell cycle distribution was analyzed with FACS analysis. The proportions of cells in each cell cycle were counted and presented as mean ± SD from three independent experiments. Bars, SD; *p<0.05. (E) Representative morphology of HMGB1 depleted (sh-2) or control (sh-c) A375 cells are shown. (F) A375 (upper panel) and G361 (lower panel) expressing HMGB1 shRNA (sh-2) or control shRNA (sh-c) were analyzed by SA-β-gal staining. The representative phase images are shown. The percentage of SA-β-gal positive cells were counted and presented as mean ± SD from three independent experiments performed in triplicate. Bars, SD; *p<0.05.

