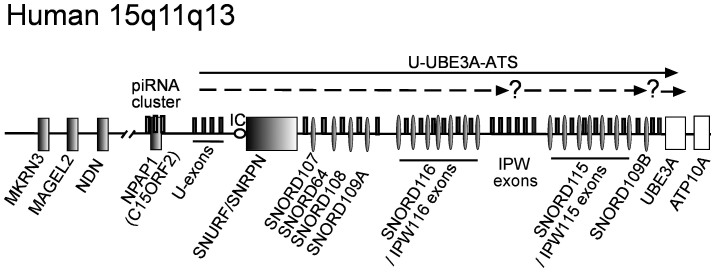
Figure 1. Organization of the human PWS locus.
Schematic representation of human 15q11-q13 region (drawing is not to scale). Protein coding and snoRNA genes are marked as boxes and ovals, respectively. Paternally and maternally expressed genes are shown with dark or white colors, respectively. Dark bars indicate alternatively spliced exons of the paternally expressed U-UBE3-ATS transcript. Known and suggested U-UBE3-AS transcripts are shown as black and dashed arrows, respectively. Question marks depict regions with identified internal TSS-tags (see also Supplementary Figure S7). The PWS imprinting center (PWS-IC) is schematically indicated by a circle.

