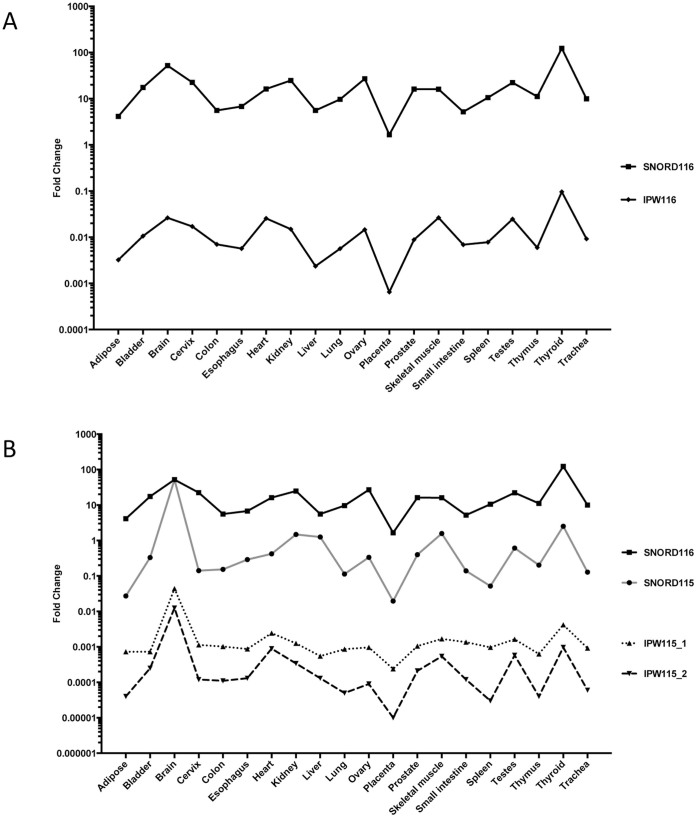
Figure 4. Expression analysis of IPW116 and IPW115 exons.
Normalized expression data of IPW116 and IPW115 exons showing fold change values obtained in 20 different human tissues by qPCR. Expression results indicate that IPW116 exons exhibit an expression pattern similar to SNORD116 (A), whereas IPW115 exons show similarity to SNORD115 expression across analyzed tissues (B).

