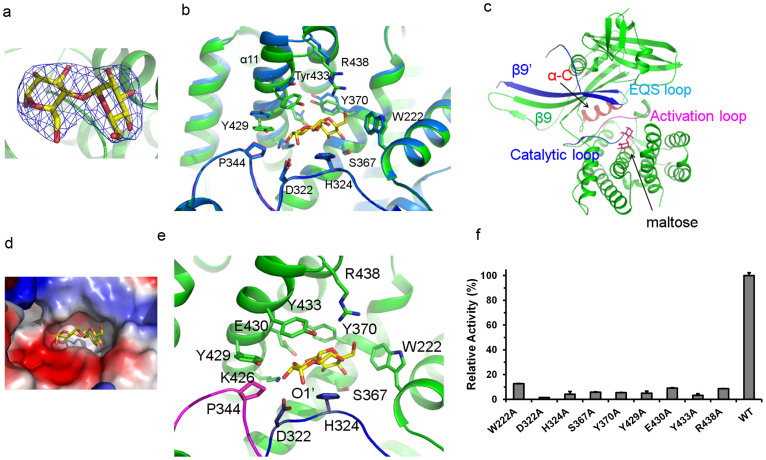
Figure 3. Maltose binding site of MtbMaK.
(a). 2Fo-Fc electron density for maltose contoured at 1.5σ is shown. (b). Conformational changes upon binding of maltose. The structure of maltose bound MtbMaK (green color) was superimposed over the unliganded structure (blue color). Main and side chains of several residues move as a result of substrate binding. (c). Maltose binds in the C-lobe and is in proximity to the conserved motifs essential for catalysis. (d). A surface electrostatic potential representation of the region around the maltose binding site. Blue represents positive potential; red, negative potential. (e). Residues interacting with maltose. Residues from the catalytic loop interacting with maltose are shown as blue sticks, while P344 from the activation loop is shown as magenta sticks. Maltose is shown as sticks in panels A-E. (f). Alanine scanning mutagenesis of amino acids interacting with maltose. Relative activity of mutants (%) with respect to the wild type is plotted as a bar graph. Error bars represent s.d. (n = 3).

