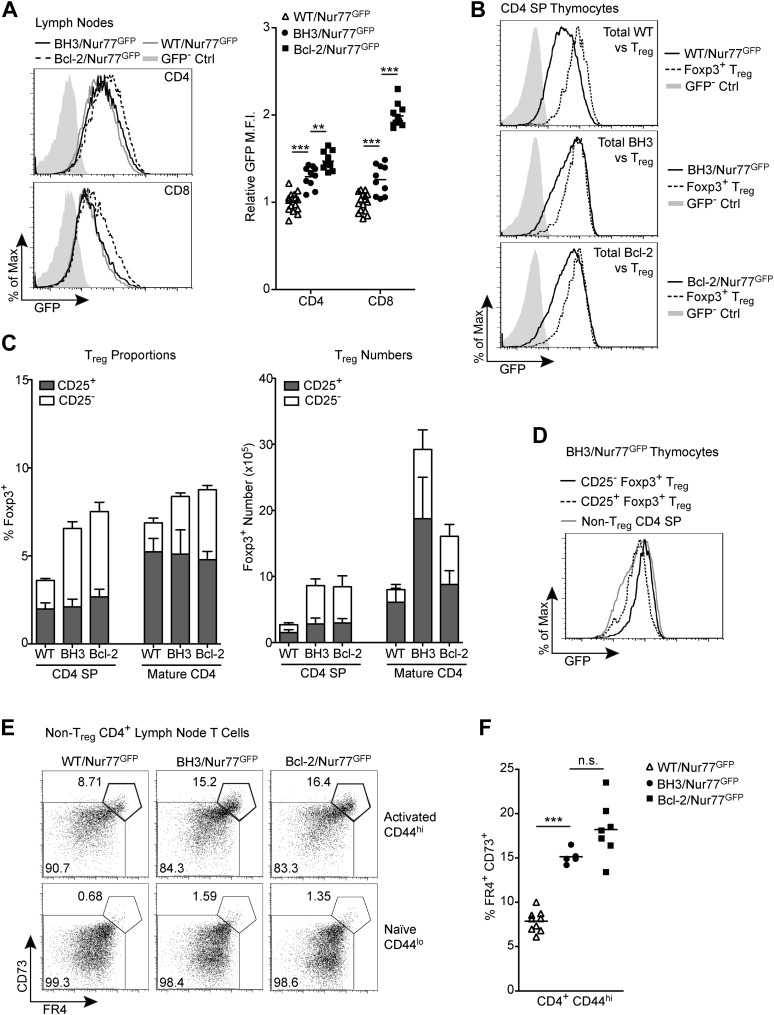
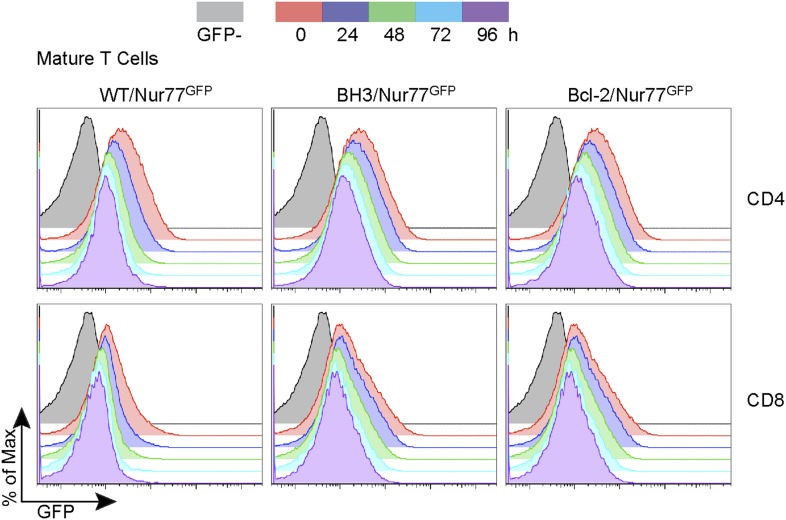
Figure 5. Alternative tolerance mechanisms in BH3 Tg mice.
(A) Flow cytometric analysis of GFP expression by mature CD4 and CD8 lymph node T cells. Quantification indicates the fold change in GFP mean fluorescence intensity (M.F.I.) relative to WT/Nur77GFP CD4 and CD8 samples. GFP M.F.I. was normalized between experiments by subtracting the M.F.I. of a GFP– control. n ≥ 10 per genotype. (B) Comparison of GFP expression by total CD4 SP thymocytes vs Foxp3+ CD4 SP Treg cells. (C) Quantification of flow cytometric analysis of CD25+ vs CD25− Treg cells (CD4+ Foxp3+) in the thymus and lymph nodes. n ≥ 7 per genotype. (D) Comparison of GFP expression levels in CD25+ vs CD25− Treg cells from BH3 Tg mice. (E) Flow cytometric analysis of non-Treg, anergic CD4 T cells in the lymph nodes. Treg cells were gated out by high expression of GITR and CD25. Anergic cells, indicated by the bolded gates, express high levels of CD44, FR4 and CD73. (F) Quantification of anergic CD4 T cells gated as described in (E). Mice were 6-weeks-old in (A–D) and 7-weeks-old in (E–F). All data are representative of or compiled from at least three independent experiments.


