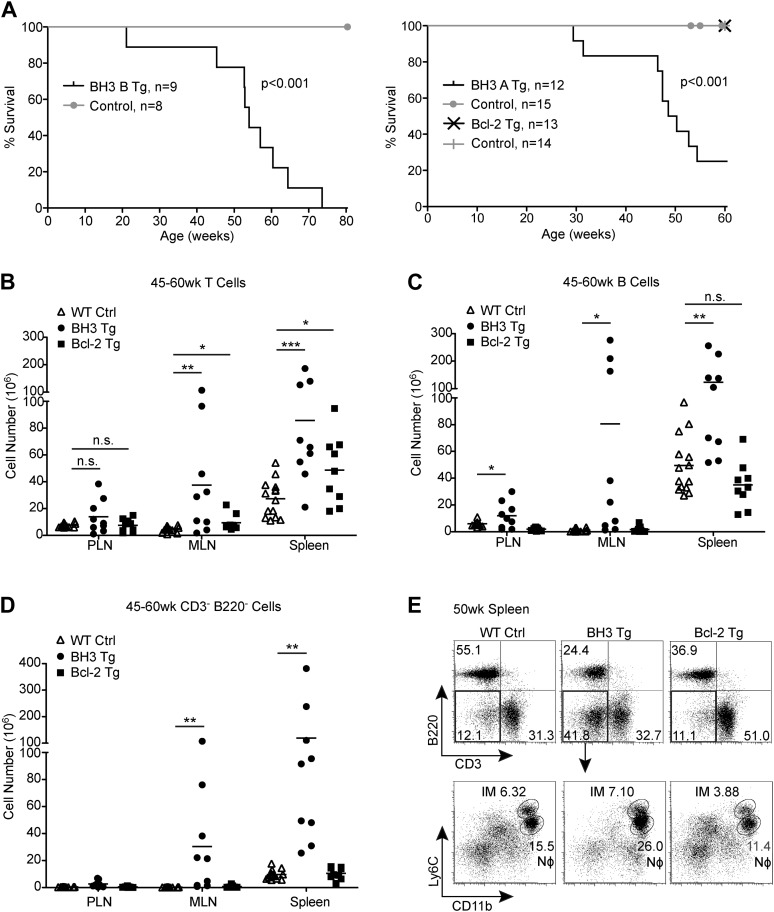
Figure 6. BH3 Tg mice have a shortened lifespan and exhibit lymphoid hyperplasia.
(A) Kaplan-Meier curves for BH3 Tg lines A and B and Bcl-2 Tg mice compared to littermate WT controls. Statistical significance was calculated using the Log-rank test. (B–D) Quantification of CD3+ T cells (B), B220+ B cells (C) and CD3− B220− Myeloid/other cells (D) in the peripheral lymph nodes (PLN), mesenteric lymph nodes (MLN) and spleen of 45 to 60-week-old mice. WT controls were littermates to BH3 Tg and Bcl-2 Tg mice. (E) Flow cytometric analysis of CD11b and Ly6C expression on CD3− B220− splenocytes from 50-week-old mice. Ly6Chi CD11b+ inflammatory monocytes (IM) and Ly6Clo CD11b+ neutrophils (Nϕ, also Ly6G+) are gated. Plots are representative of at least five mice per genotype.

