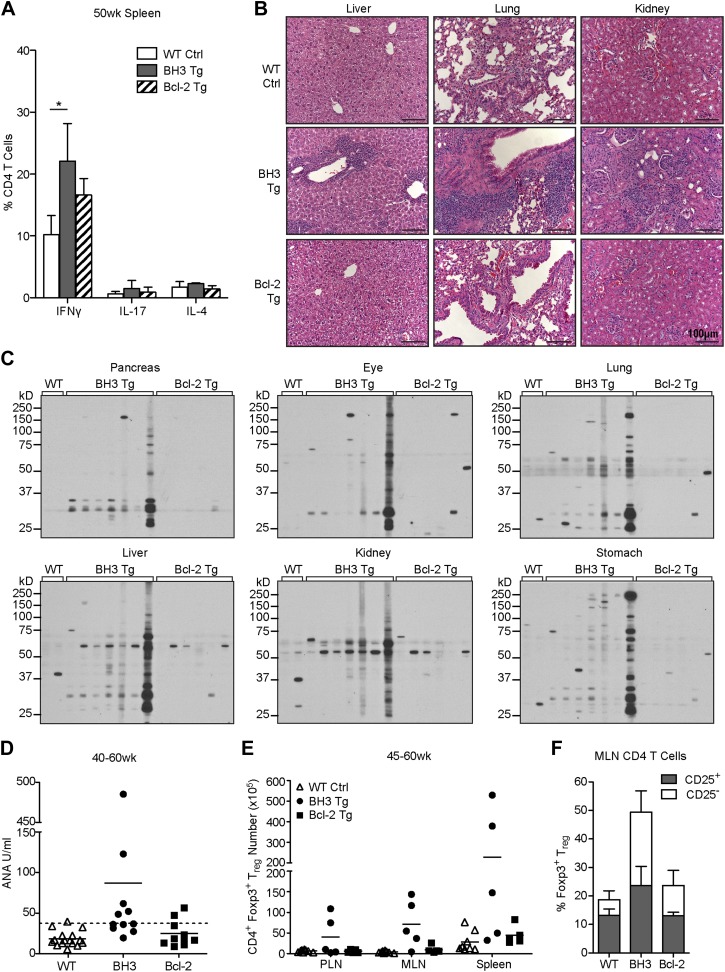
Figure 8. T cell autoimmune pathology is apparent in BH3 Tg mice.
(A) Quantification of flow cytometric analysis of T helper cell cytokine expression. Splenic CD4 T cells from 50-week-old mice were stimulated with PMA and Ionomycin for 4 hr in the presence of brefeldin A to allow cytokine accumulation. n ≥ 3 mice per genotype. (B) Hematoxylin and Eosin staining for lymphocyte infiltrates in liver, lung and kidney sections from 50-week-old mice. Images were captured at 20x magnification. Data are representative of at least three mice per genotype. (C) Sera immunoblots for detection of autoantibodies. Whole tissue extracts were probed with sera from 40 to 50-week-old mice. Each lane corresponds to sera from an individual mouse: WT n = 2, BH3 Tg n = 7, Bcl-2 Tg n = 6. (D) Serum anti-nuclear antibody (ANA) quantification by ELISA. Dashed line represents two standard deviations above the WT mean. Samples above this line are considered positive for ANA. (E) Quantification of CD4+ Foxp3+ Treg cells in the lymphoid organs of aged mice. (F) Percentage of CD4 T cells that are Treg cells (CD25+ vs CD25−) in the mesenteric lymph nodes of 45 to 60-week-old mice. n ≥ 5 mice per genotype.

