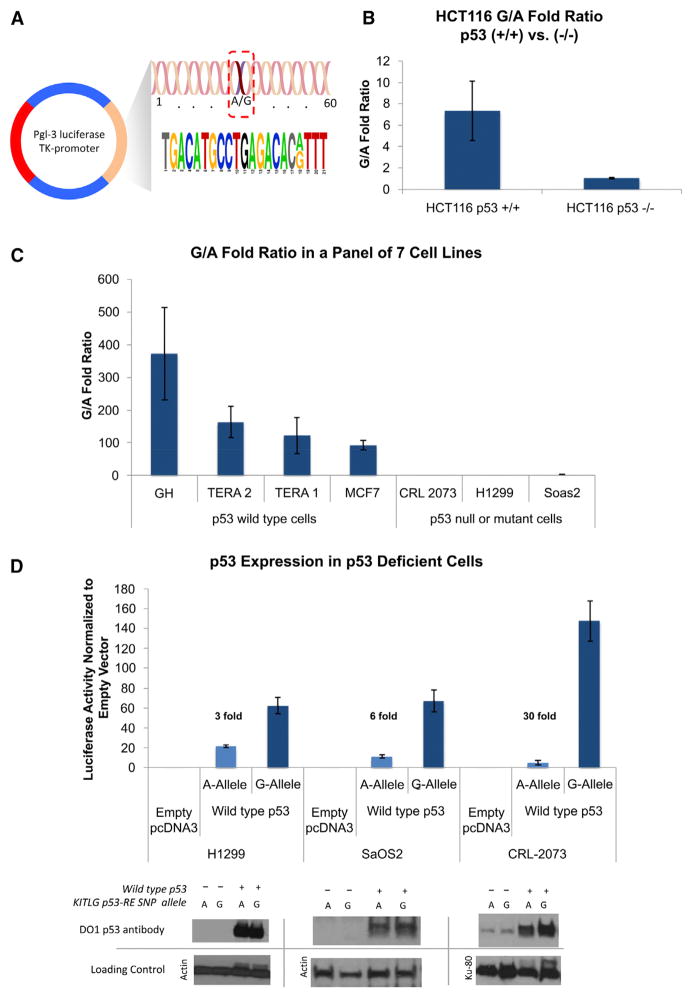
Figure 4. The KITLG p53-RE SNP Results in Allele-Specific Differences in p53-Dependent Transactivation.
(A) The 60 base pair region surrounding the SNP, which was cloned into a pGL3 luciferase reporter vector.
(B) A bar graph depicting the fold ratio of luciferase activity from transiently transfected reporter plasmids containing either the G or A alleles into a pair of HCT116 cell lines containing either the wild-type p53 gene (+/+) or without (−/−).
(C) A bar graph depicting the fold ratio of luciferase activity from the reporter plasmids into seven diverse cancer cell lines with wild-type p53, mutant, or no p53.
(D) A bar graph depicting the fold ratio of luciferase activity in the cell lines with mutant or no p53 upon cotransfection with an expression vector containing wild-type p53 cDNA, as well as a western blot analysis of p53 levels in the transfected cell lysates. Top: western blots using a monoclonal p53 antibody (DO1). Bottom: western blots of the same filter using antibodies to either actin or KU-80 as loading controls. Error bars represent SEM of three independent experiments each performed multiple times.

