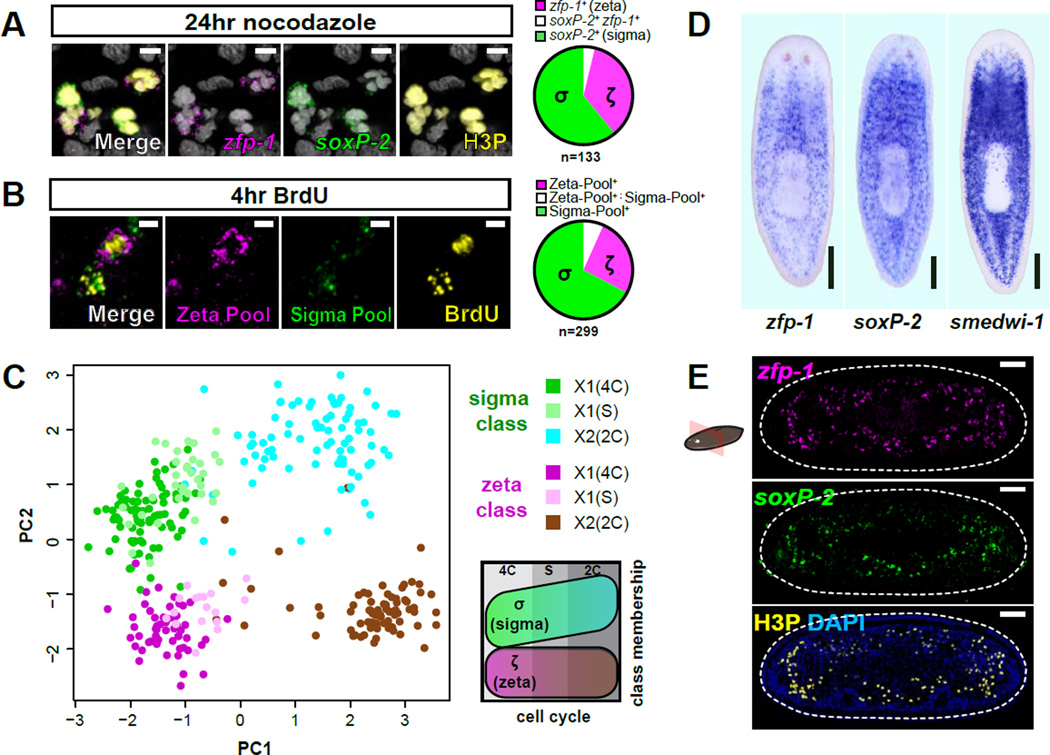
Figure 2. Neoblast classes do not reflect anatomical localization or cell cycle state.
A. Representative confocal plane from prepharyngeal region after Nocodazole treatment. FISH of ζ-class (zfp-1) and σ-class (soxP-2) shows colabeling with phosphorylated histone H3 (H3P) immunofluorescence (IF). Pie chart indicates class distribution for 133 mitotic cells (from 5 individual animals) that displayed detectable levels of class marker transcripts (n=308 total H3P+ cells analyzed). Scale bars, 5µm. Nuclei are labeled by DAPI (grey).
B. Representative confocal plane from a planarian subjected to a 2hr BrdU pulse and 2hr chase and labeled by pooled class FISH probes and BrdU IF. Pie chart indicates class distribution for 299 BrdU+ cells (from 3 individual animals) with detected class marker expression (n=402 BrdU+ cells analyzed). Scale bars, 5µm.
C. PCA of qPCR data from individual neoblasts isolated from cell cycle-restricted FACS gates. Each dot represents a cell, colored based on its FACS gate and class membership (determined by HC). PC1 separates cell cycle stages whereas PC2 separates the classes. Schematic illustrates the distribution of cell cycle stages and classes over the plot area.
D. Whole-mount ISH comparing spatial distributions of ζNeoblasts (zfp-1) and σ Neoblasts (soxP-2) to the global neoblast population (smedwi-1). Ventral views, anterior up; scale bar, 200µm.
E. Transverse tissue section labeled by whole-mount double-FISH shows the spatial distribution of CNeoblasts (zfp-1) and σNeoblasts (soxP-2). Mitotic cells are labeled by IF for H3P. Dotted line indicates animal boundary. Dorsal up; scale bar, 50µm.

