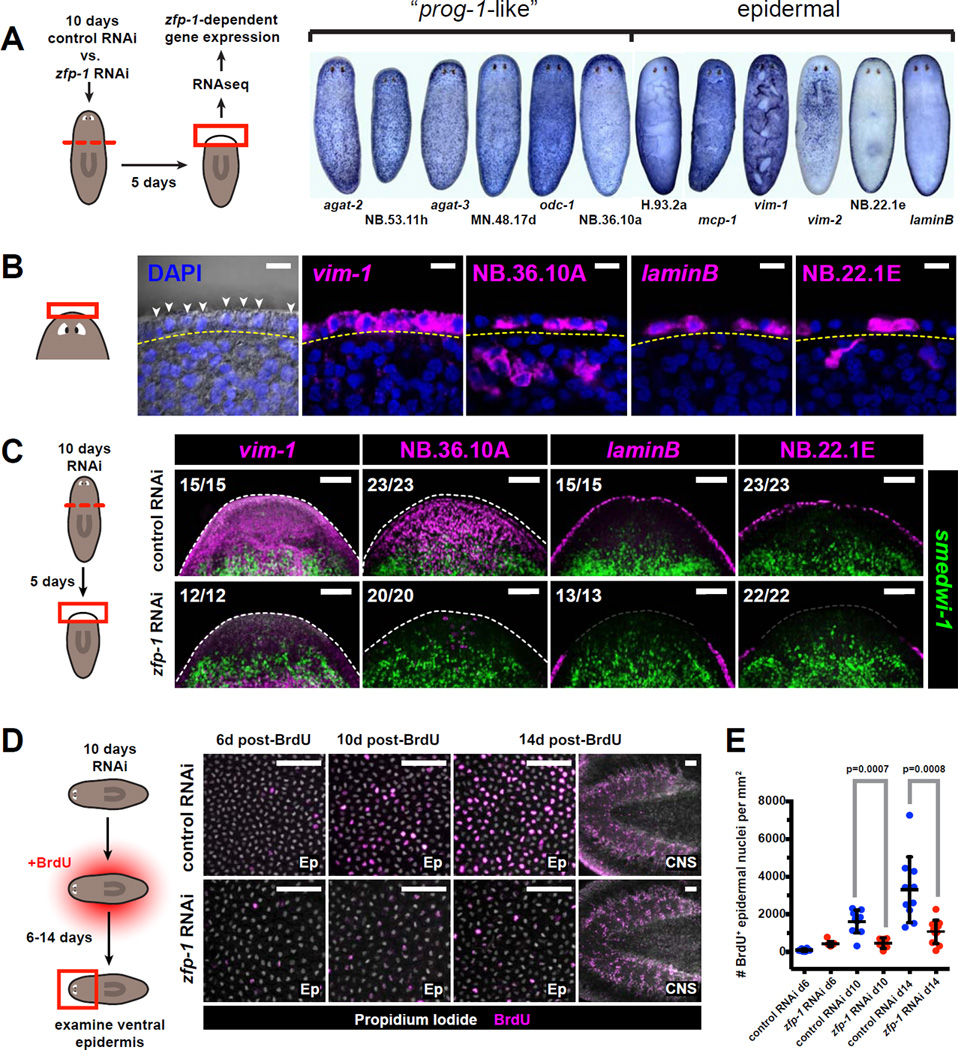
Figure 6. The ζ-class is involved in epidermal regeneration.

A. Schematic for RNAseq strategy used to identify transcripts differentially expressed in zfp-1 (RNAi) vs. control blastemas. Whole-mount ISH patterns for several transcripts identified by this strategy are shown at right.
B. Several genes identified in (A) are expressed in the planarian epidermis. Left panel shows epidermal nuclei (arrowheads) in the head rim, distal to the basement membrane (yellow dotted line) as visualized by differential interference contrast (DIC) microscopy. Right panels are confocal planes from animals labeled by FISH. Labeled cells are found distal to the basement membrane. Scale bars, 10µm.
C. Tissue fragments cut from 10-day RNAi animals were fixed 5 days post-amputation and assessed by double-FISH. Total numbers of animals with displayed tissue patterns are indicated. Dotted lines indicate animal boundary. Scale bars, 100µm.
D. Effects of zfp-1 RNAi on epidermal cell turnover. Images depict the ventral epidermis from anterior regions of RNAi animals 6–14 days after BrdU labeling. Rightmost images depict CNS tissues, in which cell turnover is not affected by zfp-1 RNAi. Scale bars, 50µm.
E. Numbers of BrdU+ epidermal cells per mm2 are plotted for each timepoint and RNAi condition. Dots represent individual animals. Lines and error bars indicate mean and standard deviation. P-values are based on unpaired Student’s t-test (two-tailed).
