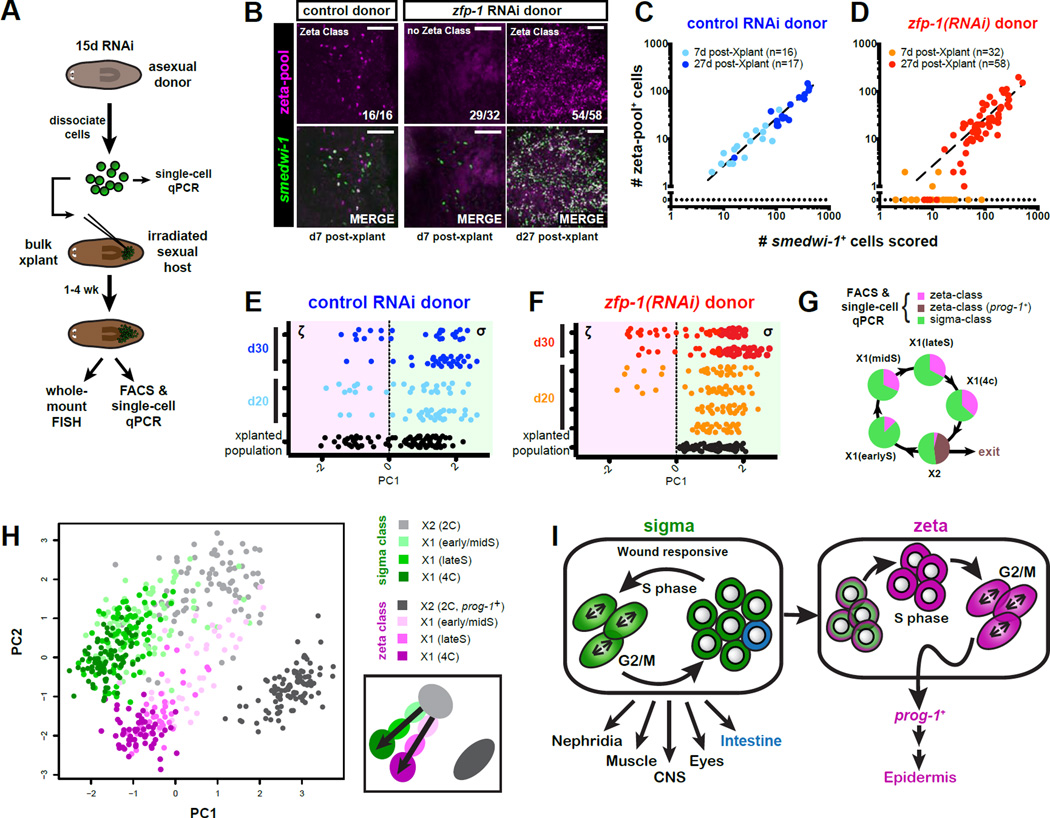
Figure 7. The σ-class regenerates the ζ-class.
A. Schematic representation of transplantation procedure. Animals were exposed to control or zfp-1 RNAi for 15 days. A subset of isolated cells was analyzed by single-cell qPCR. Remaining cells were transplanted into lethally irradiated hosts and allowed to expand up to 30 days. Transplanted populations were assessed by single-cell transcriptional profiling or whole-mount FISH.
B. Representative confocal images of neoblast grafts derived from control or zfp-1 (RNAi) donor cells. Hosts were fixed 7 or 27 days post-transplantation, and labeled by FISH probes for smedwi-1 and the ζ-class. ζ-class gene expression was undetected in the majority (29/32) of day 7 grafts from zfp-1 (RNAi) donors, but was robustly detected in grafts (54/58) assessed at day 27. Scale bars, 50µm.
C–D. Log-scale plots of scored smedwi-1+ cells plotted against numbers of cells that co-expressed ζ-class markers for transplant grafts described in (B). Each dot represents an individual graft. Line represents linear regression fit of the control RNAi data.
E–F. PCA of individual X1 cells from transplants at 0, 20, and 30 days post-transplantation. Each row represents a host, each dot represents a cell. Cells from control (blue, E) and zfp-1 (RNAi) grafts (red/orange, F), are plotted against the first PC value, which reflects class membership. Positive PC1 value assigns a cell to the σ-class; a negative value to the ζ-class. zfp-1 (RNAi) grafts contain only σ-class cells at day 0, but at later time points ζ-class cells are detected.
G. Cell-cycle restricted X1 cells were isolated using different FACS gates (see Fig. S7C) and profiled by qPCR for 96 genes. Pie charts indicate class membership (determined by HC).
H. PCA of single-cell qPCR data from different cell cycle-restricted FACS gates. Each dot represents a cell. Colors indicate FACS gate and class membership. PC1 separates according to cell cycle stage; PC2 indicates class membership. Schematic depicts the distribution of cell cycle stages and proposed class transitions. (See also Figure S7C,G)
I. Model of the neoblast population. Two major classes, the σ-class and the ζ-class, represent functionally separate neoblast compartments. σNeoblasts are able to self-renew, and collectively gives rise to a wide range of tissue types. Over the course of S-phase, a subset of the σNeoblasts gains markers specific for theζ-class. These cells give rise to the prog-1-related lineages and to epidermal cells.

